Silver still under an hourly sell from this morning, but I decided to pass on a short in that market.
ES is on track for the triangle idea.
It's trading right in an area of recent support. If it drops through the ES 1170 mark with any authority then the triangle possibility would be in question. I like to watch the volume profile study for clues as to support/resistance levels. Following is a chart of that for the ES:
This study shows the volume of contracts traded at different price levels over the last 6 months (blue histogram on right). The idea is that spikes in volume at a level indicates resistance/support. As can be seen, the ES 1180 to 1173.50 area has a significant volume spike and thus should be support, which so far is proving to be the case. The other side of this is that the next area of major support isn't until ES 1140, so any serious break below this level has the possibility of dropping 30 points in a hurry.
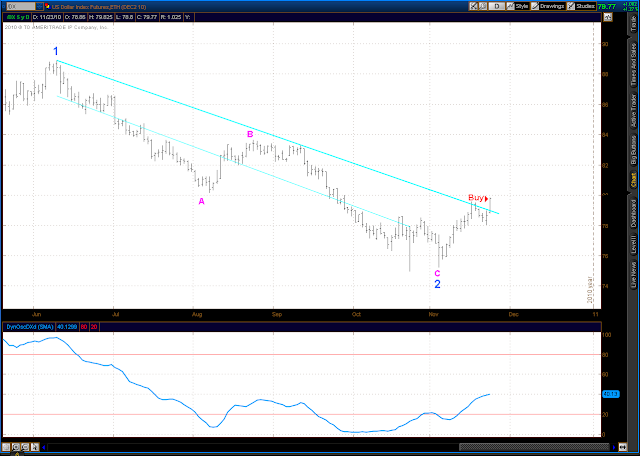
On currencies, the DX had a daily close above it's downtrend line from the highs of early June, so it is now in a confirmed uptrend.
The EUR and AUD are the reverse of this, of course, and the EUR is particularly weak. The EUR is in a confirmed downtrend on the daily Trend/Osc dating back to Nov 4.
Current Elliott count shows the EUR to be in a Minor Wave 3, so this should be strong and swift to the downside, which so far has been the case.
Doesn't look like there's any major support until EUR 1.26 - 1.28, so this could be a pretty good ride.
Tuesday, November 23, 2010
Subscribe to:
Post Comments (Atom)


Never received the email. Please send message to JBGRYG@aol.com
ReplyDelete