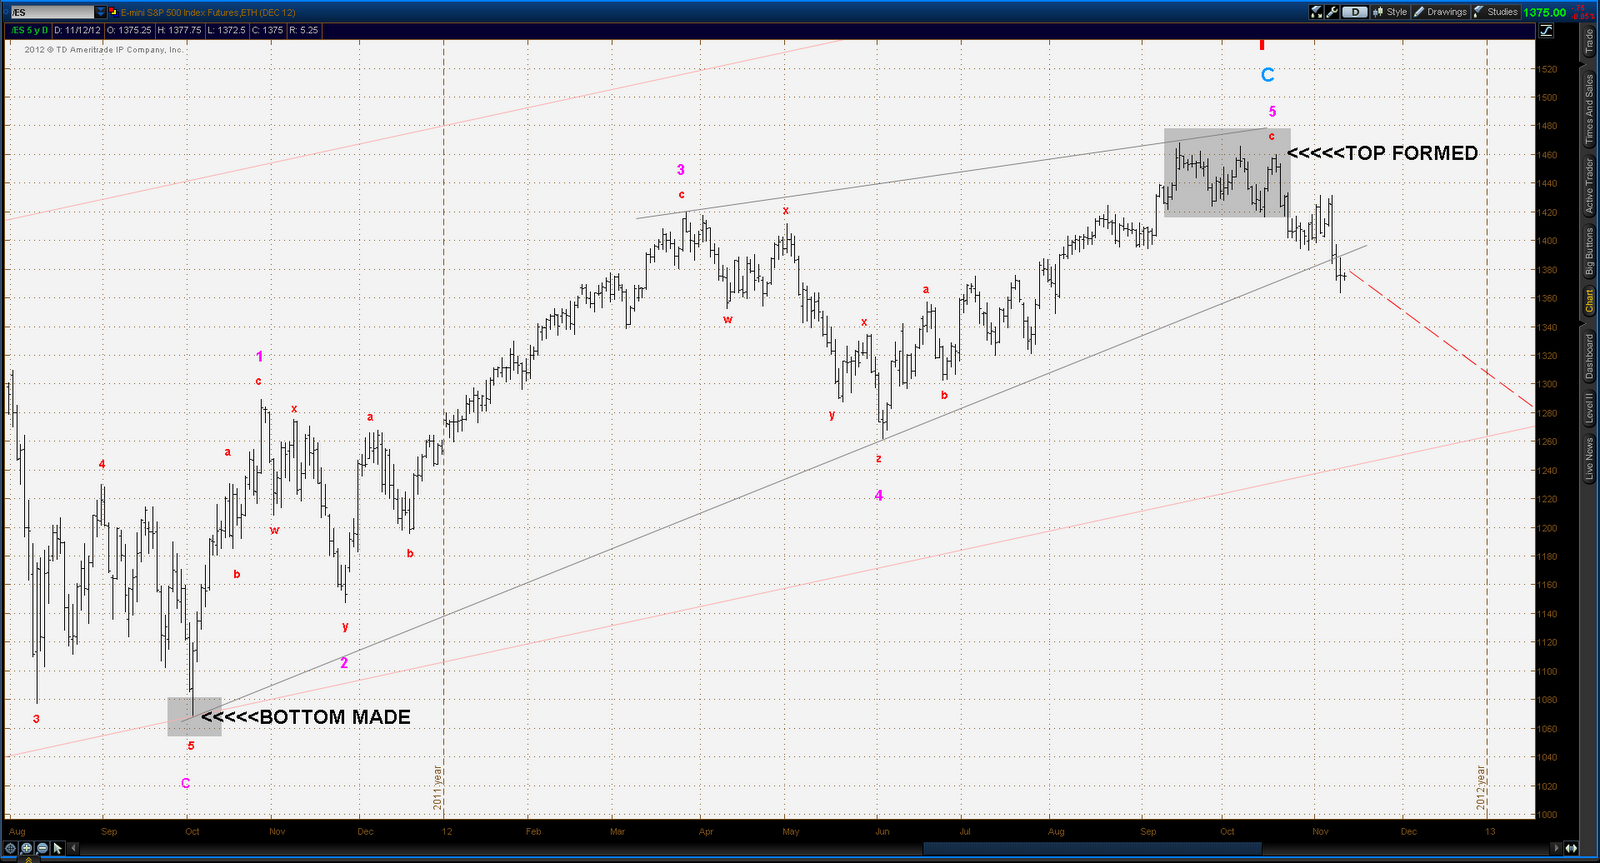
There is a very strong seasonal up bias in the period of Thanksgiving through the end of year holidays, so a bull market of some sort should be no surprise. The question is, what sort of bull will it be? i.e. are we going to see a choppy corrective type sequence that will fail and lead into the next downstroke of a major bear that commenced at the Sep - Oct highs? Or will it impulse up with new highs in the offing?
This author can think of several very solid arguments, both technical and fundamental, to buttress both the bull and bear case. So as usual events have transpired in a manner to obfuscate what is most likely in the intermediate term. However, from a very short term perspective the market ended the week in a very "overbought" condition, so a quick pull back is likely sometime in the next two days or so.
Current short term EW counts look as follows:
Bull alternate
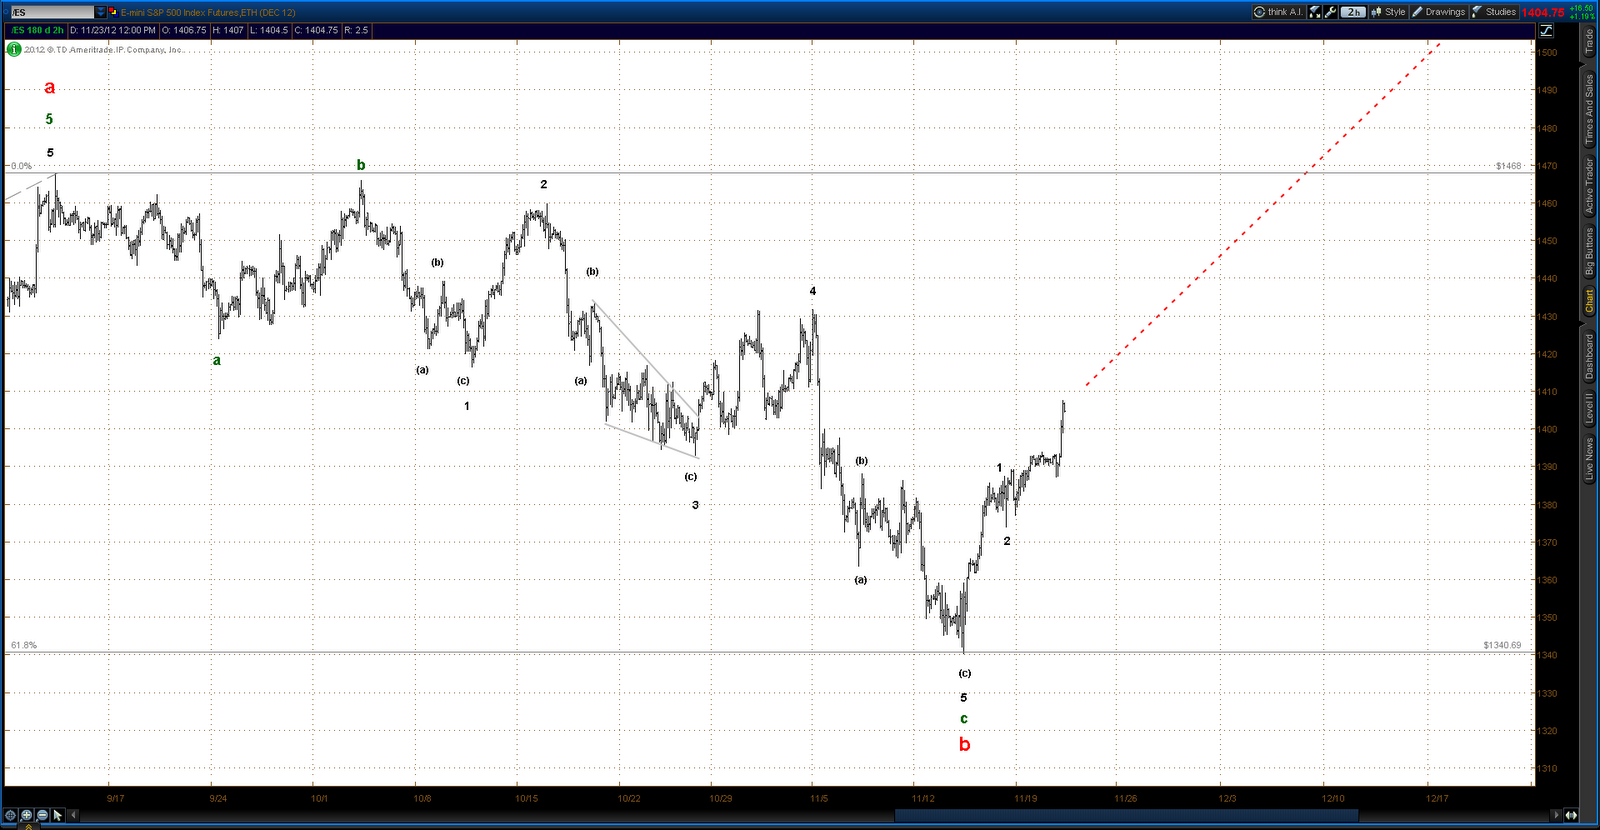
Bear alternate

It should be noted that in the bear alternate the top of the current rally off the Nov 16 lows may only be the first leg of Minor W2 (red numbers) rather than the entirety of the move. In this case this move is only the first zig-zag of a double or triple zig-zag sequence or it is the "a" leg of a 3-3-5 flat type structure. This thought occurs when comparing the duration of Minor W1 at 21 days to the duration of Minor W2 of 4 days to this point - it is likely that Minor W2 will unfold in a manner that chews up more time. This would also allow for a continuation of the usual holiday season rally sequence deeper into December.