It's nice to get something right once in a while, so forgive me if I boast. The chart below is the chart presented on the Thursday update, red dotted line is my projection. As you can see, the ES read the memo and followed instructions. Right.

On to reality. Two most likely possibilities for the coming week are first, a continuation of a Minor Wave 2 correction that started at last Thursday's high or second, Minor Wave 2 was complete at the early AM Friday low and it's up, up and away in Minor Wave 3.
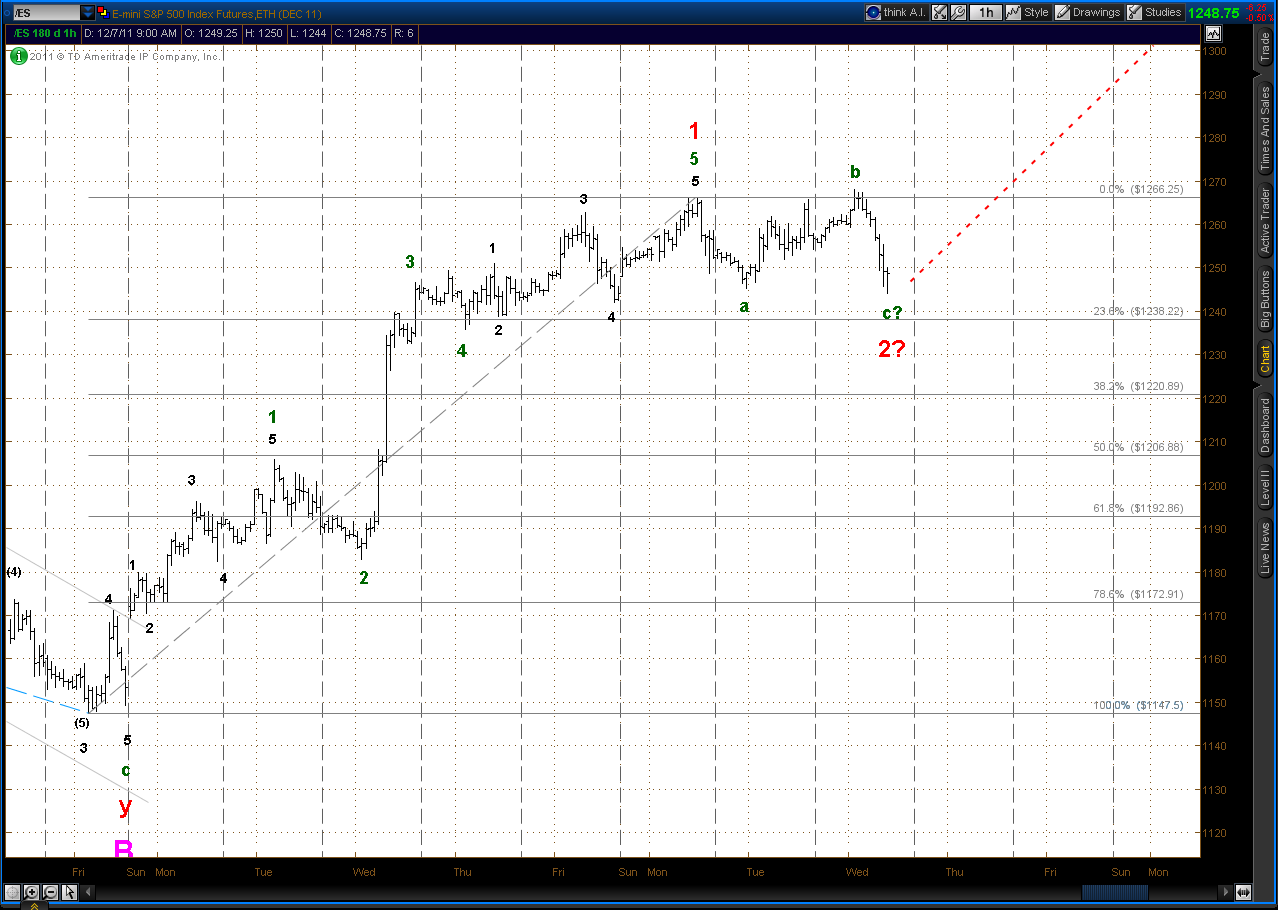
Alternate 1 - Minor W2 continues

Alternate 2 - Minor W3 in progress

The coming week is December options and futures expiration week, those weeks have a bullish tendency. Also, the European deal struck Friday should lift some bearish sentiment off the market, at least temporarily (that is, until everyone realizes that it's a positive in the long run, but in the short run there is still a lot of European overspending and excessive debt). Finally, December tends bullish on a seasonal basis. So the edge has to go to Alternate 2.
One other note on charting the ES. The Minor Wave 1 labeling at the print high on Thursday looks odd on the charts, but it's because TOS rolled from the December to the March contract on Wednesday evening. This can be a problem with applying Elliott Wave to futures markets continuation charts.

The fix is to examine a non-continuation chart for the next monthly expiration in the series to gain clarification. As you can see, the proposed Elliott count doesn't look quite as odd if it is applied to a chart of the March expiration ES:


 A close above the downtrend line on the below chart would be a first indication of a bottom being in place and a resumption of the up trend that started on Nov 25.


 The fix is to examine a non-continuation chart for the next monthly expiration in the series to gain clarification. As you can see, the proposed Elliott count doesn't look quite as odd if it is applied to a chart of the March expiration ES:

 Looks like a flat type correction, possibly done at the low a little bit ago. Nibbled at a long ES position with a tight stop (stop @ today's low), we'll see if it works.


