CURRENT CHARTS


Click HERE to view current charts


Monday, December 26, 2016

Monday, 12/26/16 update

The activity since the mid-December highs looked to be a triangle type correction in progress.  That still may be the case, but it's also possible that the pattern will be a simple zig-zag.  Both possibilities are noted in the hourly chart below.  Either way we should see a rally to new ATH's once the corrective sequence is resolved.


Daily chart:


Saturday, December 17, 2016

Saturday, 12/17/16 update

Christmas rally in the ES continues in progress.  If this count is accurate the ramp up from the election day low has some distance yet to travel.

Short term count:

Longer term view:

Saturday, December 10, 2016

Saturday, 12/10/16 update

Moon shot in progress.  Who knows, the way this is unfolding we could well be aiming for Mars!

Long term view has the ES/SPX in Major Wave 5 of the bull market that commenced in the spring of 2009.  Current count has it in Minute W3 of Minor W3 of Intermediate W3 of that 5th wave - i.e. the 3rd of the 3rd of the 3rd.  The price action since the election day low certainly has been confirming this view.


A very preliminary target for Major W5 is ES 2569, but the emphasis is on preliminary.  It's far too early to know how probable that target may be. 

Saturday, December 3, 2016

Saturday, 12/3/16 update

Current preferred count for the ES:


Sunday, November 20, 2016

Sunday, 11/20/16 update

The election rally has obviously lost steam over the last week.  The pattern over the last 6 trading days looks to be an ending diagonal.  With that in mind the current short term count in the ES has 5 waves up complete since the overnight low of election day:


If this count is accurate then we should see some corrective selling over the coming holiday week.  The longer term question is whether that correction is a 2nd wave as in the 1st alternate below or a "B" wave as in the 2nd alternate:

Alternate #1 - Intermediate W3 of Major W5 of Primary W3 in progress


Alternate #2 - Major Wave B of Primary W IV in progress


Saturday, November 5, 2016

Saturday, 11/5/16 update

The current preferred count is that the ES/SPX is in the later stages of a double zig-zag correction that commenced at the August highs.  Short term proposed count looks like this:


From a longer term perspective it appears that the ES/SPX is either in Primary W IV of the bull market that dates back to Mar '09 (1st chart below) or is still building Major W5 of Primary W III of that structure (2nd chart):

Alternate #1: Primary W IV in progress


Alternate #2: Major W5 of Primary W III in progress

Sunday, October 30, 2016

Sunday, 10/30/16 update

Let's see - 3 way move off Wednesday's low into a high Thursday morning, followed by a three wave move down into a low early Friday morning, followed by a 5 wave impulse into a high late Friday morning, but that high is significantly lower than Thursday morning's high.  Looks like a running flat to me. Very bearish.


Saturday, October 22, 2016

Saturday, 10/22/16 update

The sideways chop in the ES/SPX that started last summer continues to manifest it's annoying self.  Hard to come up with a high confidence EW count, here's a best guess:


Saturday, October 15, 2016

Saturday, 10/15/16 update

The triangle "X" wave posited in last weekend's update played out pretty much as anticipated.  That wave terminated on Monday and a 5 wave impulse down ensued leading to a low on Thursday morning.  The bounce since that low put in three legs into a high Friday morning, adequate for a correction, so it may be that another leg down has commenced.  If all this is correct, then since the Monday triangle terminus we've seen either waves A & B of zig-zag "Y" or we've seen waves 1 & 2 of wave A of that zig-zag:

 
Backing out to a longer view the two most likely possibilities are that Primary W III of the bull market since the '09 lows topped this summer with Primary W IV in progress (1st chart below) or the ES/SPX is working out Major W5 of Primary W III (2nd chart below).  Couple of things to note: on the 1st alternate Primary W II was a simple zig-zag, so Primary W IV needs to be a flat, triangle or some type of complex corrective sequence as per the EW rule of alternation. On the 2nd alternate the count is invalidated if the market continues selling off and drops below the assumed start of Minor W1 at ES 1981.50.


Saturday, October 8, 2016

Saturday, 10/8/16 update

In early September the ES/SPX sold off hard and bottomed on Sep 12.  The ensuing rally was impulsive and strong and looked to be the start of a bullish run.   But except for another short bullish burst a week and a half later the pattern has been anything but impulsive - in either direction.  Just a slow sideways grind that is enough to make one scream.  So it's hard to see this situation resolving itself to the upside.   The problem from an EW standpoint is that the pattern is ambiguous enough to suggest a number of possible counts.  One of those is below, IMO it is the most likely solution but not by much:


Monday, September 26, 2016

Monday, 9/26/16 update

Didn't publish the bear alternate on Saturday, but today's follow through selling has put an impulse down off last weeks high.  The move has been more sustained than would be expected in the bull alternate from the w/e post, although that alternate cannot yet be ruled out.  But if we continue down below the ES 2100.25 low of Sep 11 then the bear alternate is probably in play.  EW counts for that alternate:


Saturday, September 24, 2016

Saturday, 9/24/16 update

Current preferred count for the ES:


Sunday, September 11, 2016

Sunday, 9/11/16 update

Awfully heavy hit on equities on Friday - down 53+ on the SPX, NYSE declines over advances by 17 to 1 and down volume over up volume by 27 to 1!  Very strong.

Last update proposed a 4th wave expanding diagonal in progress with a quick 5th wave yet to come.  Obviously that's not happening.  Looking at the pattern of recent weeks there are all sorts of possible counts.  One of those possibilities is that the 5th wave anticipated in the alternate referenced in the last post has in fact occurred.  Reworked count using that idea is as follows:
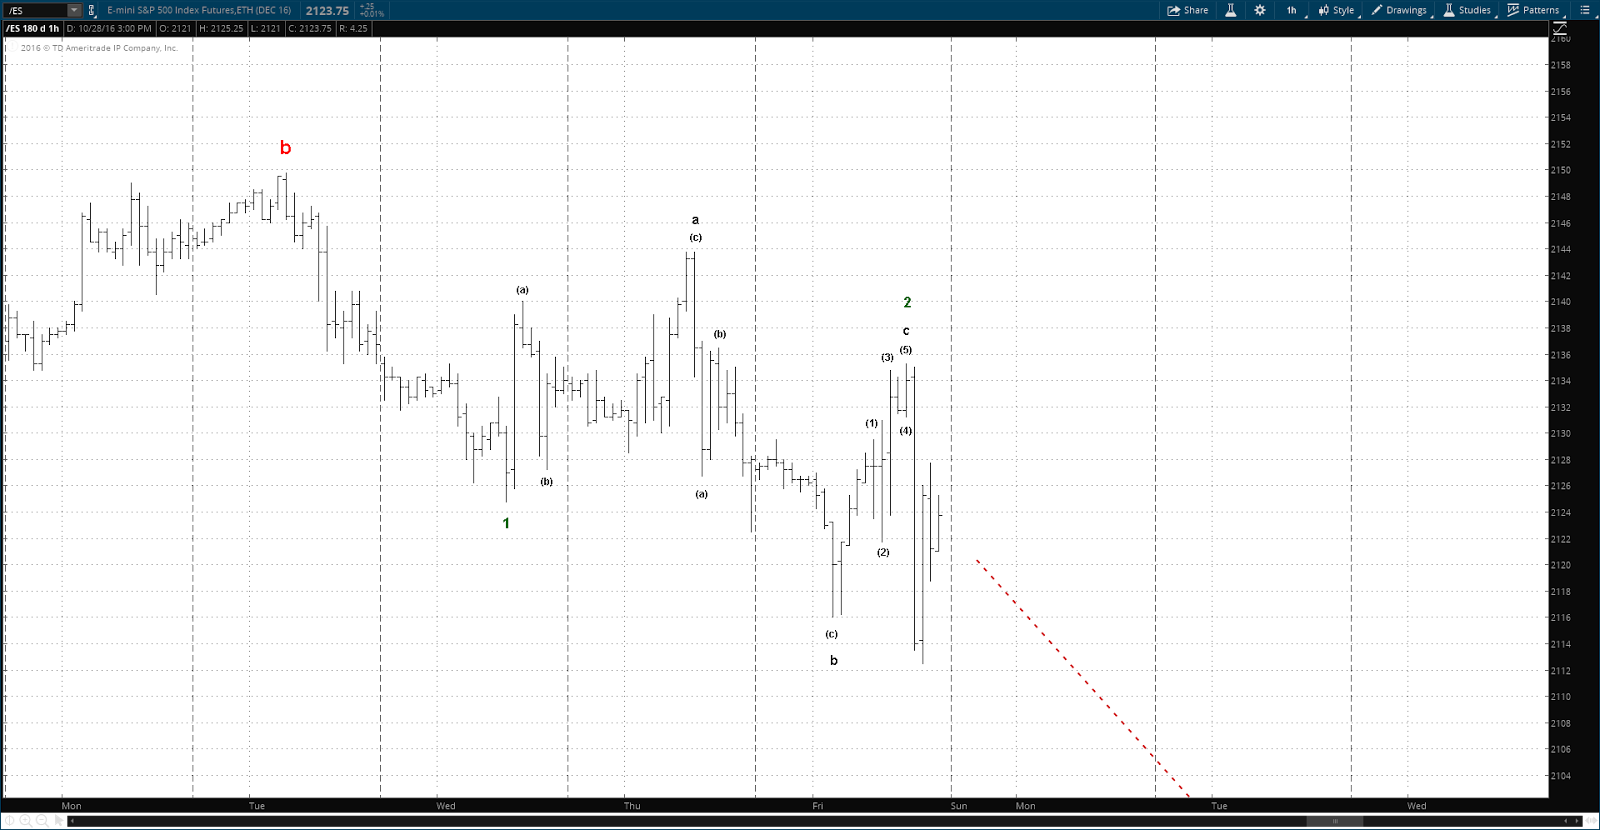
Hourly bars

Daily bars

If this count is the one that is in play then the ES is in Primary W IV which should be a significant decline - several months and several hundred points.  A prior 4th wave of lower degree is the usual target for a 4th wave, in this case Major W4 bottomed around ES 1800, so that would be where Primary W IV may be headed.

The main alternate here would be that the top that was established in August was Minor W1 of Inter W3 of Major W5 as below:


In this case the ES is in a 2nd wave which should bottom relatively soon with far less damage than the 1st alternate proposed earlier.  A continuation of the bull market in the form of Minor W3 should ensue.  This count is invalidated with a drop below the starting point of the proposed Minor W1 at ES 1981.50.

Monday, September 5, 2016

Monday, 9/5/16 update

The "c" wave ED proposed last Thursday got blown up with Friday's rally.  The sideways track of recent weeks is beginning to look like an expanding triangle.  Triangle corrections are only found in 4th waves of 5 wave impulse sequences, and that brings an alternate count into view, which is that the ES completed Intermediate W3 of Major W5 at the mid-August high:


Since Inter W1 is longer than Inter W3 in this count, the Inter W5 that will commence at the conclusion of the Inter W4 triangle has to be shorter than Inter W3 to comply with EW rules.  So a relatively short burst for Inter W5 is likely.  Currently two possible targets for the Inter W5 top are at ES 2228 and 2261, but these targets are very tentative.  If this count is correct, that Inter W5 top will also be the top for Major W5 and in turn Primary W III, so there should be a significant bear market following that event.

Short term count for this alternate looks like this:


The count that has been preferred at this site is still possible and thus in play.  That count has the mid-August top labeled as Minor W1 of Inter W3 with Minor W2 in progress.  If that count is in fact the correct one then the significant top anticipated by the alternate outlined above gets pushed a lot farther down the road.

Thursday, September 1, 2016

Thursday, 9/1/16 update

Still looks like a flat correction in progress from the Aug 15 high in the ES, with the "c" and final leg forming an ending diagonal:


If the move lower from the "b" wave high isn't an ED then it's a whole bunch of nested waves 1 & 2 - that doesn't seem too likely.

Tuesday, August 23, 2016

Tuesday, 8/23/16 update

Looks like a flat correction in progress over the last week and a half.


Sunday, August 14, 2016

Sunday, 8/14/16 update

From a long term perspective the equities markets continue to show divergences of the blue chips as measured by the S&P 500 as compared to the broader market, represented in the below charts by the NYSE (NYA) and the Russell 2000 (RUT):


My current long term count has the ES/SPX working out at least one 4th/5th wave sequence of the bull market that commenced at the MAR 2009 lows.  A narrowing of relative strength in equities to favor blue chips vs other issues is a characteristic of 5th waves, so the long term perspective is confirmed by the above charts.  The obvious message is that a bear market of some significance is getting closer.

On the short term, crude oil looks to have established a low at almost exactly a 50% retrace of the early February to early June rally:


This could provide some lift to the ES/SPX.

Current EW counts for the ES can be found here.

Sunday, August 7, 2016

Sunday, 8/7/16 update

ES/SPX finally woke up from it's mid-summer slumber this last week.  The EW count has not changed significantly after the last two weeks of sideways churn.  Alternate counts are essentially the same as those proposed two weeks ago:


OR 


Saturday, July 23, 2016

Saturday, 7/23/16 update

The last seven trading days have been entirely forgettable: a slow sideways grind.  These types of periods are difficult to chart from an EW perspective.  Here's what it looks like in the ES futures, but this may need to be revised as the market continues to develop:


As can be seen, if this count is correct then the rally that commenced at the end of June should resume after a relatively minor correction over the next day or two.  Again, that's IF this count is correct.

Backing out to a wider view, we have two impulsive sequences up from the Jun 27 low:


The preferred count is that those impulses have formed waves 1 through 3 of the move into the recent high with wave 4 in progress and wave 5 to follow with targets at ES 2202 and 2254.

An alternate view would be that the pattern up from the Jun 27th low is a series of nested waves 1 & 2:

Saturday, July 16, 2016

Saturday, 7/16/16 update

Short term ES count:


Intermediate term:


Long term:


Saturday, July 9, 2016

Saturday, 7/9/16 update

More bull market this week from the land of forever up.  Bears (of which I am one) need to get off the tracks for the time being lest they get run over (which I have done).  The ATH in the ES was at 2134 last year, we came within 9 points of that at Friday's high.  Doesn't look like that level will provide any real resistance at this point. 

Hourly chart

Daily chart 

I've been wondering if a new amendment to our Constitution was passed that mandated BTFD.

Sunday, July 3, 2016

Sunday, 7/3/16 update

The long term count for the ES has been revised:


Notes on the revision can be found here.

Current short term count: