CURRENT CHARTS


Click HERE to view current charts


Thursday, September 30, 2010

Thursday 9/30/10 wrap up

The sell off from this morning's highs is clearly a 5 wave impulse, which signals a possible downtrend in the making.

A flat style correction was one of the possibilities considered in last weekend's update post, and it explains the action this week quite nicely.  If that's what we're getting, then we are most likely in the "C" leg of that pattern which should be the strongest, thus there should be sharp follow through selling tomorrow.  If this is in fact a correction to the September rally, then a .382 retrace would be in the ES 1103 area and a .500 retrace comes in at ES 1090.  Es 1090 has been an important area of support/resistance in recent history.

The daily Trend/Osc is still in bull mode but only because the Dynamic Oscillator remains above 80.0.  Prices have closed below the uptrend line as of today.  So the caution light is flashing.

The hourly Trend/Osc is also flashing yellow with prices hovering around the uptrend line on that chart. The Dyn Osc is already in sell mode with readings below 80 and in a down trend to boot.  Putting this all together today I hedged the long ES's with some options around 2 PM with the ES trading a little above 1140.  If we do get a Trend/Osc sell signal overnight, as seems likely, then the ES position will be reversed from long to short and the hedge options will be retained.

Thursday 9/30/10 update

Don't like the way this looks, am looking for a spot to possibly hedge long ES.  As long as prices do not close below uptrend line the Trend/Osc is still in bull mode, but the drop from this AM's high is an impulsive looking 5 wave move which may be the 1st wave of a change in trend to the downside.

Wednesday, September 29, 2010

Wednesday 9/29/10

Somewhere in hell I believe there is a devil who has been given the job of torturing traders.  He also pulls wings off flies as a hobby.  I believe he's been in charge this week.

Actually, it's the end of the 3rd quarter tomorrow and it looks like the big boys are hands off to protect their gains from this month for the 3rd quarter report.
So no real change from yesterday's count, just a sloppy mess waiting for a push in one direction or another.

Still in bull mode on the daily chart, although today was somewhat of a doji which may indicate that we're topping.

Tuesday, September 28, 2010

Tuesday 9/28/10 wrap up

Daily Trend/Osc still in bull mode.  Interesting that today's low bounced right off the up trend line.

Today was a continuation of yesterday's choppy and overlapping activity, but with more volatility.  The pattern since Monday's highs still qualifies as a wave 2 to Friday's wave 1.  However, if we don't rally steadily from here that whole count becomes questionable as the supposed wave 2 will be extending a little too far in time to be reasonable.

The long ES from Friday has been held through the choppiness of the last two days.  Which brings up a subject:  retracements versus changes in trend.  Markets never go in straight lines, there always is backing and filling along the way.  When an apparent change of trend occurs there will be an almost inevitable retrace early on.  However, sometimes that retrace itself turns into a change of trend.  So how does one distinguish between the two?  More importantly, when should a move opposite to the preceding direction be traded? 
The Trend/Osc system has a rule which uses the 14 day value of Wilder's ATR.  The rule is that a move opposite an existing trend is to be considered a change of trend only if the existing trend has moved a minimum of two 14 day ATR's from it's start point or the start of the change in direction occurs more than two days from the existing trend's start point.
Applying this to today and yesterday it works out as follows:
14 day ATR = ES 17.00 points
Start of uptrend = Thursday between 2 & 3 PM
Low preceding uptrend = 1117.25
ATR test:  2 ATR's above 1117.25 = 1117.25 + 34.00 =  1151.25, market topped at ES 1149.75 Sunday night so did not exceed that trigger;
Time test:  2 trading days from 2 PM bar on Thursday is 2 PM bar on Monday, market topped Sunday night so did not exceed time trigger  -

-therefore-

Selling on Monday and Tuesday is to be treated as a retracement rather than a change in trend, so continue to hold long (unless stopped out) even though there was a Trend/Osc sell signal today.


Monday, September 27, 2010

Monday 9/27/10 wrap up

Daily Trend/Osc is still in bull mode.

Action today was choppy and overlapping just like last Wednesday and Thursday, take away message is also the same: wave 2 to a wave 1, in this case Friday's wave 1.  The low today was right in the .382 level against Friday's rally.  We need to turn up fairly soon from here to keep this proposed count in play.

I'd like to follow up on the discussion about market volume started on the weekend update.  Here's an expanded and modified version of the MS Excel chart posted in that update:

The green line in the chart is a line graph of the daily closes on the NYSE going back to mid-July of 2003 through present.  Scale for that is on the right side of the chart.  The black line on the bottom of the chart is a 90 day moving average of NYSE daily total volume.  Scale on the left side of chart.
When looking at this chart, understand that the volume component is a 90 day moving average, so the volume graph should be mentally shifted a little to the left to align it more accurately with price activity.  What's striking in this chart is the change in volume pattern after the market top in 2008.  For the first few years of the rally from 2003 volume steadily increased with prices, which is what one would expect.  Then volume flattens out as the market nears its top and finally volume diverges against higher prices, this pattern also is what one would expect.  Now look at the right side of the chart and note the volume pattern since the bottom of March, 2009.  Here we see volume DECREASING as prices rise, followed by a volume spike accompanying this years sell off, and then (again) another pattern of volume decreasing as prices rise.  This is very ominous.  Granted, this study only looks at the NYSE, I don't have one which includes the NASDAQ, but my guess is that the pattern wouldn't change much if at all.
To understand the implications look at it this way:  Let's say there was a fashion show by a famous designer where he showed off his new line of slinky black dresses.  Let's also say that you hear that the full year's production of those slinky black dresses was sold out at that show.  You'd be pretty bullish on slinky black dresses, wouldn't you?  Now let's say that you later hear that there were 100 buyers at that show, but only 10 of those buyers submitted bids on those slinky black dresses.  Now how bullish are you?
One final note.  I believe this volume pattern is ominous, but its bearish message is more a long term consideration, i.e. it could be quite a while before the lack of volume translates into a down market.   Also, it's entirely possible that volume will pick up at some point and make the pattern since March '09 irrelevant.

Saturday, September 25, 2010

Weekend Update 9/25/10

As usual, there are several alternatives here that are apparent, two intermediate term bullish and one bearish.  Intermediate term my preference tends to the bullish side.  I've recently applied the Trendline/Oscillator approach to an ES daily chart, and that shows us solidly in bull mode at this point with prices above an uptrend line from the early month lows and the Dynamic Oscillator tracking above 80.0.

I'm sure a lot of folks will agree that Friday's rally was a surprise.  Although the choppy and overlapping nature of Wednesday's and Thursday's selling was clearly corrective in nature, two days of selling hardly seems enough to work off the excesses of the 16 solid days of relentless rally that preceded it.  In addition, the bottom on Thursday only represents a .236 retrace of that rally, which is pretty shallow.

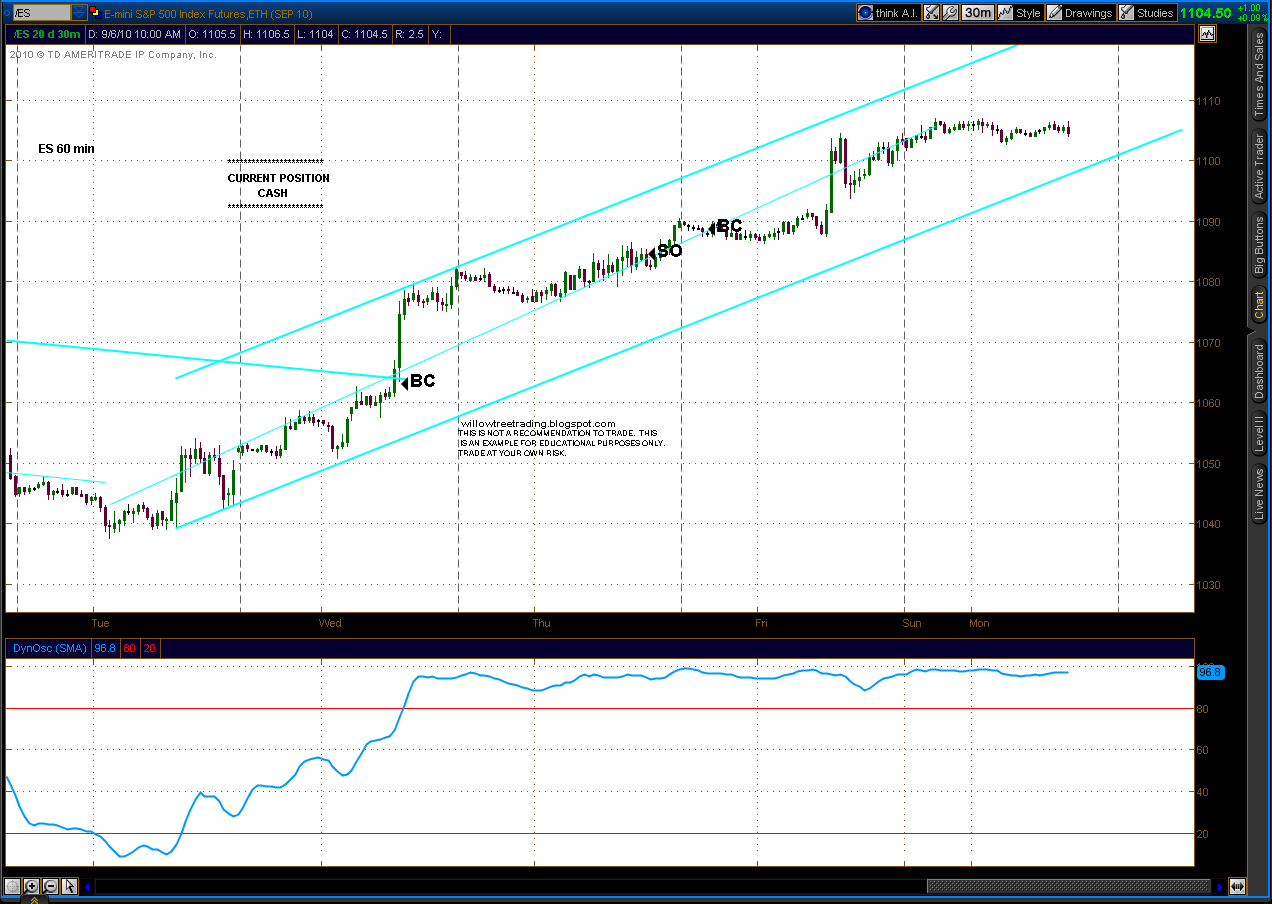
Zooming in on the above chart, if we have in fact seen the extent of the correction, then Wednesday and Thursday are best labeled as a zig-zag 2nd Wave with Friday a sub-wave 1 almost complete, so another quick correction should be in order early next week immediately followed by a strong sub-wave 3 rally.

However, we were quite overbought as of close Friday on an hourly basis, and the shortness and shallowness of the midweek correction suggests the distinct possibility of one more deeper corrective leg to set up a strong rally.  In this case we are tracing out a flat style correction with the "A" leg done at Thursday's low and the "B" leg complete or almost complete, with a strong and impulsive looking "C" leg dead ahead.  If this develops, look for that "C" leg to find support at the .382 level around ES 1103 or, more likely, the .50 level around ES 1090.  ES 1090 in particular has been important resistance/support in recent history.

There is an intermediate term bear case which needs consideration, and that viewpoint shows us at a potential significant top as of right now.  In that view the early July lows marked the end of a 5 wave leading diagonal Major Wave A or 1, and we have since been in a Major Wave B or 2.  That Wave B is taking the form of a 5-3-5 zig zag, with wave 5 of the C leg complete or almost complete as of Friday's close.  If this is correct, look out below.

One other thing to address which is a longer term concern is the continuing lack of trading volume.  I've tracked volume, a/d and other statistics for many years.  Following is a chart out of MS Excel which plots an 8 day moving average of NYSE total volume against the NYSE composite.  The charts speaks for itself.
(Prices (green line) on right scale, Volume (black line) on left scale) 

Friday, September 24, 2010

Friday 9/24/10 update

9:15 AM
Adventures in trading this AM.  On Stop & Reverse situations I enter the stops in two parts, 1st is stop loss on original position, 2nd is buy (in this case) on stop with stop loss on that position if buy on stop is hit.  Canceled buy on stop with conditional stop loss @ 8:25 AM,  then tried to cancel base stop @ 8:35 thinking I could get better entry (market was trading in 1132.00 area).  Couldn't get a confirm that stop was canceled so entered order to close short ES's which was executed.  Finally called TOS trade desk a little while ago and found out 2nd stop loss cancel was unsuccessful and was actually executed so am long ES @ 1135.00.


Changed Stop & Reverse to straight Stop Loss @ 1135.00.

Thursday, September 23, 2010

Thursday 9/23/10 wrap up

Lots of overlapping waves since the highs on Tuesday, looks very much like a developing triple zig-zag pattern.  It's either the first leg of a correction to the rally from late August or it will be the entirety of that correction.  More likely it's the first leg as it doesn't seem reasonable that 2 or 3 days of selling would correct a solid three weeks of rally.  Also, it's hard to imagine that this pattern is the onset of more than a correction given it's choppy and overlapping nature.

Trend/Osc sytem generated a sell at 4 AM this morning when the Dyn Osc dropped below 80.  Waited for a retrace to act on that signal and hit it fairly well with a short ES position established @ ES 1131.00 a little after 10:30 AM.  So currently holding short with a Stop & Reverse @ 1135.00.

Wednesday, September 22, 2010

Wednesday 9/22/10 wrap up

Price action since yesterday's spike highs has been more choppy and corrective than impulsive, at this point it's not indicative of a change in trend to a bear market.  But that can change.

Prices have clearly broken below the up trend line from late August.  However, the Dynamic Oscillator has not moved below the 80.0 level, so no sell signal as of yet on the Trend/Osc system.

Tuesday, September 21, 2010

Tuesday 9/21/10 wrap up

Two possible bullish Elliott counts, first one has a 5th wave ending diagonal complete at today's highs:

An alternate bullish count has us putting in a series of wave 1 - wave 2 sequences of progressively smaller degree since the August lows:

I lean towards the first count rather than the alternate, there are divergences showing up on many indicators and it would reasonable to expect some corrective activity after three solid weeks of up market.  If the alternate count is correct, than we should see a very powerful 3rd of a 3rd of a 3rd rally commence by the end of the week.
Still catching up from my absence of last week so haven't had time to develop a bear alternate, hope to look at that tomorrow.

Speaking of divergences, the clearly divergent Buy/Sell Vindicator of last week obviously was not telling us anything at that time.  The Buy line still continues to diverge from the high readings of earlier this month.

The Trendline/Oscillator system is still in bull mode, watch for a break of the up trend line accompanied by a reading below 80 on the Oscillator to confirm a change to a bear trend.

Friday, September 17, 2010

Friday 9/17/10 update

Quicky update, still on the run this week:

Notice how buy line in buy/sell Vindicator has been diverging significantly against prices the last week couple of weeks:

Monday, September 13, 2010

Monday 9/13/10 wrap up

I will not be able to post every day this week and will most likely not be trading, events have conspired to give me what might be termed "calendar overload".  Should calm down some next week.

First chart is just something to ponder.  It's a weekly SPX chart of 1994 and 1995. There was a mid-term election in 1994.  Clinton was President and had a Democratic Congress in 1993 and 1994, the Republicans swept the election based on wide spread disapproval of Democratic policies and wrested control of Congress away from the Democrats. Sound familiar?

I'm compelled to once again point out today's tepid volume.  In August we heard the low volume was typical and the result of summer holidays.  Last week we heard that the low volume was due to Labor Day and the Jewish New Year.  What's the reason today?

The price pattern in the ES last week was very choppy and consisted of 3 wave moves in both directions.  It appears very much to be a wedge or triangle type pattern.

In EW theory triangles always precede the last leg of a move, so from a larger perspective the most likely count looks like this:

If this is correct, and it is a big IF, then we should finally see a more serious correction to the rally that started at the end of August.

Trendline/Oscillator is still in bull mode and will stay so until such time as prices break below the (blue) up trend line accompanied by a break below 80 on the Dyn Osc.

Thursday, September 9, 2010

Thursday 9/9/10 wrap up

Elliott bear count - getting more and more awkward:

Elliott bull count, a lot cleaner:

Okkam's razor says the simplest answer is usually the correct one, so despite the continued low volume the vote has to go for the bull case.

Got stopped out of Monday night's short ES this morning at breakeven. With today's highs the Trendline and Dynamic Oscillator reset.  We are currently flirting with another sell signal on the Trend/Osc.

Wednesday, September 8, 2010

Wednesday 9/8/10 wrap up

This market continues to be marked by a lack of volume and thus participation.  The explanation in August was summer vacations, but we're now past Labor Day and still weak volume, I suppose that will be chalked up to long Labor Day holidays.  Actually, the better explanation is lack of interest in equity investments, which should reflect in lower prices at some point.  Which means we should see the recent magical levitating act come to a sad end.  I say should, never forgetting that this IS the two ton elephant that will do whatever it pleases.
      Enough of that.  The near term bear case is suspect at this point as a result of today's action.  It was pretty clearly a 5 wave pattern up that took the better part of the day, and in Elliott Wave 5 waves usually occur in the direction of the underlying trend, the exception is if they are the "C" leg of an A-B-C correction.

 A bear count can be had out of the price pattern of the last two days, but it looks a little awkward and requires the action since Tuesday morning to be labeled as a (very) irregular flat.  Stranger things have happened, but it is a bit awkward.
 
The bull count says we completed a Wave 1 up overnight Mon-Tues and the down stroke into this morning's lows was a triple zig-zag Wave 2, with the 5 waves up today a subwave 1.  A little more plausible from an Elliott standpoint, but hey, again, this IS the two ton elephant.

At some point we will break out of the primary trading range of recent months.  Top of the range is around ES 1129 and the bottom is around ES 1037.  My guess is whichever way we break out of this range it will be with some power and probably mark the start of a sustained trend in that direction.  
 

Tuesday, September 7, 2010

Tuesday 9/7/10 wrap up

Well we rolled over as anticipated.  Now the question is whether this will be a correction to an ongoing rally or the start of more serious selling.  Answer: to be determined.
Looking at the rally from last Tuesday's lows the Fibonnaci retracement levels are ES 1080.50 (.382), 1072.50 (.500) and 1064.25 (.618).  We're at the ES 1090 area which is the .236 level and is strong support.  If we break below this the 50% retrace area around 1075 looks important.

Monday, September 6, 2010

Labor Day 9/6/10 update

On the very short term it looks like 5 waves up are complete on the ES as of the close of this morning's holiday trading session.

From a longer term perspective, there are three possibilities worth mentioning.  My preferred count is a bearish one, and under it we have just completed the C leg of a Wave 2 correction and are tipping over into a Wave 3.

There is another near term bearish, longer term bullish possibility which popped out at me this weekend, and that is that we have been building an A-B-C-D-E triangle or wedge since the highs in April, with the D leg just complete and the E leg just started.  This E leg would mark the end of a multi-month corrective sequence and would usher in a multi-month rally that should equate to the advance of March '09 through April of this year.
In order for this scenario to hold true we must immediately roll over.

The bullish alternate is that an intermediate Wave 2 ended at last Tuesday's lows and that we are just wrapping up Wave 1 of an intermediate Wave 3.

From a trading standpoint there is no effective near term difference between the triangle scenario and the bullish scenario, they both call for a relatively short lived (3 - 5 days) pullback to a level not lower than last Tuesday's lows which would be followed by a long term rally sequence.

On the Trendline/Oscillator System we could very easily see a drop below the down trend line that currently defines the rally from last Tuesday.  If accompanied by a drop below 80 on the Dynamic Oscillator we would have a sell signal.  There is every possibility that this could happen overnight tonight.  We are certainly due some sort of pullback after the relentless rally of the last week.

I'm seriously considering shorting ES at tonight's open with a stop a tick or two above the recent high of ES 1107.00.  The close this morning of the abbreviated holiday session smelled like a top.

Thursday, September 2, 2010

Thursday 9/2/10 wrap up

Looks like 5 waves up from Tuesdays lows are complete or close to complete, should see a pull back soon.

Trend/Osc is still in bull mode.

Broke discipline and shorted ES today, will probably dump that tonight sometime.  Trade was pure speculation and not based on anything other than close to done on 5 waves up and overbought on some standard market measures such as RSI, etc.  Still PO'd about TOS situation yesterday, that shaded my thinking today, guess I'm not a rock after all.  We are probably due for at least a retrace, but I have rules on if, when and how to play that which weren't considered today.

Wednesday, September 1, 2010

Wednesday 9/1/10 wrap up

Extremely frustrated with TOS today.  Could not retrieve any charts this morning due to problems with their new software release, but price displays indicated that the ES was up strong overnight and trading very close to the Stop & Reverse point.  As a result, the short ES's were covered a little after 8 AM CST at 1063.00, but a long position was not established because of the lack of charts.  It would be like driving at 80 MPH on a moonless night on a country backroad with the headlights off - a little too dicey.  At around 9 or 9:30 TOS finally came through with instructions as to how to restore a prior version of software with back up charts, but by then the market was a runaway and the best bet would be to wait for a pull back to go long IMO.  Chasing markets can be a high risk move.  As I write this the ES is trading @ 1080.50, so I figure that TOS owes me $850 per contract (1080.50 - 1063.00 x $50) of missed profit opportunity.  Think they'll pony up?

The preferred bearish count here shows us in a Wave 2.  It is rather awkward in some areas.  In this count a .618 retracement of Wave 1 is right around ES 1093.00.

The bullish alternate is even more awkward on an hourly chart, because of the TOS problems my saved hourly chart of the bull count is inaccessible, but I do have a daily chart.  It basically shows a zig zag Wave 2 ending at the ES 1037 lows with a Wave 3 in progress.