CURRENT CHARTS


Click HERE to view current charts


Sunday, May 26, 2013

Sunday, 5/26/13 update

FINALLY some selling in equities.  The question is, was that a two day flash in the pan and back up we go?  The odds are pretty good that we've seen an intermediate term top IMHO - seasonally there's been a spring downturn in recent years, sentiment is at bullish extremes by a number of measures, momentum indicators have been pegged in "overbought" territory and (not least) there appears to be a completed 5 wave bull pattern at last weeks highs.  And then there's this:


The NYA appears to have been repelled at the middle tine of the Andrew's pitchfork in the chart for the 3rd time since the Oct '11 lows.  Also, the volume study shown has marked the onset of selling 3 out of 4 times in the last few years when it hits close to the .70 mark (that volume study is a simple one - 30 day sum of up volume divided by 30 day sum of tot volume).

So assuming that last weeks highs mark an intermediate term top, the current EW count on the bull alternate shows a Minor Wave 3 complete and Minor Wave 4 in it's earliest stages.  In this count Minor W2 was a flat, so Minor W4 needs to be a zig-zag or triangle to satisfy the EW rule of alternation.


A possible target for Minor W4 is at ES 1553.75 which is a .382 retrace of Minor W3 and an area where two prior 4th waves of lesser degree have occurred.

Internal count for Minor W3:


Zoomed in on Minute W5 and after:


Saturday, May 18, 2013

Saturday, 5/18/13 update

Equities continue to power relentlessly ahead.  Currently the preferred count has the ES/SPX in a 3rd of a 3rd of a 3rd of a 3rd wave, so the nature of the action fits what's expected in EW.


As mentioned last week, the EW count from the Nov 16 low has been revised more than once as the move has continued to extend.  The same can now be said of the wave that started at the Apr 18 low as it continues to surge upward.


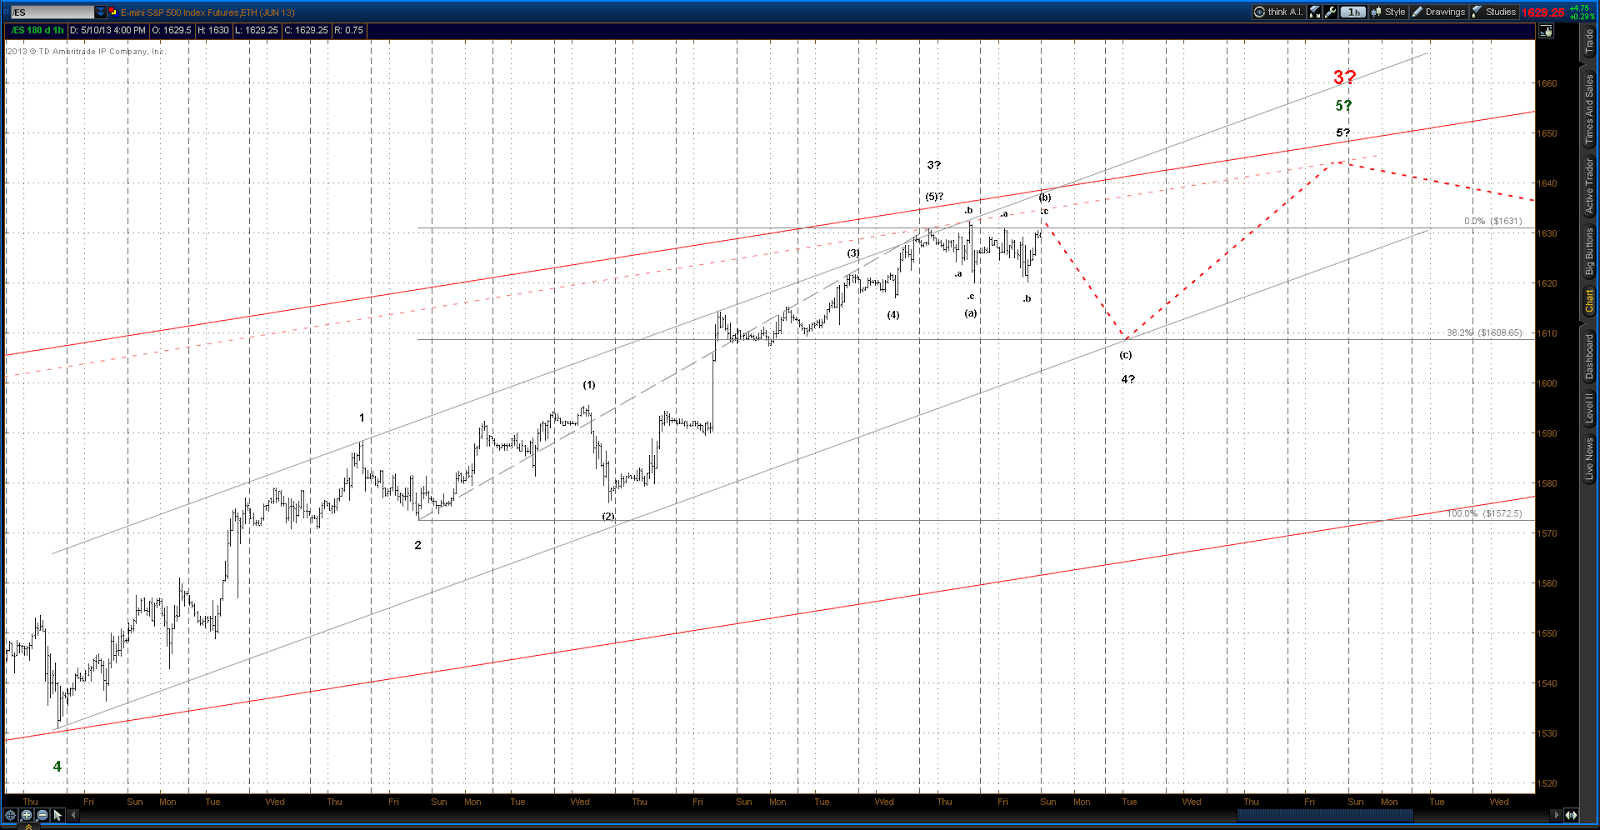
It needs to be noted that the slope of the rally off the Apr 18 lows is steeper than any other segment of the sequence since Nov 16, and at this point the buying doesn't show signs of letting up.  The possibility in this context is that Minor W3 (red) has quite a distance yet to run and that the series off the Apr 18 lows is actually the center of Minor W3.  That series would thus be a 3rd wave rather than a 5th wave.  In that case Minor W3 is continuing to extend and the Minute, Micro and Nano waves designated in the current analysis would be revised to lower degrees.  

Possible targets for  the whole shebang from the mid-Nov lows are at 1678.50 where Minute W5 = 1.50 x Minute W1 and at 1681.50 where Micro W5 = .618 x Micro W1.

--------------------------------------------------------------------------------------------------------------------------

This site hasn't discussed any bearish alternates for a while now.  The reason is that they appear far less probable at this juncture given the power of the current bull move.  Also, the bearish alternate most favored had an ending diagonal in progress.  The strong push past long term resistance in the upper 1500's has blown up that thought.  But that reality does not rule out the idea that the whole structure from Mar '09 is in fact a double zig-zag which is corrective in nature rather than impulsive.

From a macro view it's worthwhile to entertain the idea that the bull move from March 2009 is one great big "X" wave that will eventually roll over into some serious bear market conditions.  It's awfully hard to dismiss the very large negative economic implications of the massive and growing U.S. public debt combined with the flood of phony money that's been funding that debt, and it seems reasonable to assume that there will be a very painful price to pay at some point.  And that price will almost certainly be very negative for equities.

From an EW standpoint it's still possible to view the bull market of the last 4+ years as an "X" wave and not break any EW rules.  The practical limit to this view is at a level where the proposed "X" wave equals a 1.236 multiple of the 2007 - 2009 bear market.  That level is at ES 1804.00.

Long term bearish alternate count

As can be seen, this bear alternate has the ES in Wave C of the 2nd zig-zag of the X wave.  Wave A is counted as a leading diagonal with a high last September, and Wave B is an irregular flat that bottomed on Nov 16, 2012.  This view allows for some further price appreciation before prices roll over into the next long term bear market.  So there's meat for all those long term bear biases out there (mine included).

Tuesday, May 14, 2013

Tuesday, 5/14/13 update

Did we see an IT top today?  Certainly is due.


Saturday, May 11, 2013

Saturday, 5/11/13 update


The above preferred count for the ES/SPX has the market in a Minor W3 off a Minor W2 low of last November.  The move has certainly been characteristic of a 3rd wave in it's relentless nature.  If the count is correct then we're seeing the last stages of Minute W5 of Minor W3 and thus an intermediate term top should be relatively nearby.  "If" and "should" in this statement are there for a reason - this move has looked to be near that IT top more then once in the last month or two, and yet has bounced right back up off a shallow and short lived correction to continue extending.  So be aware that the move could continue extending from here and that the anticipated IT top is actually not in close proximity.


Zooming in to the very short term, Micro Waves 1 through 3 of Minute W5 appear complete at the high of 1531.00 of last Wednesday (May 8).  The pattern since that high has been choppy and complex, not unusual for a 4th wave, and it also alternates well with the simple zig-zag of Micro W2 on Apr 25 - 26.  Micro W4 should wrap up fairly soon, if it hasn't already ended.  Micro W1 traveled 57.50 points and lasted roughly 5 days, so Micro W5 should travel a distance that is a fibonnacci multiple of 57.50 and be roughly 3 - 8 days duration.  The dotted lines in the above chart assume that Micro W4 will be a .382 retrace of Micro W3 and will thus carry down to 1608.50, and that the subsequent Micro W5 will be a .618 multiple of Micro W1 and thus run up to an eventual high of 1644.00 as a result.  There are a lot of assumptions there so the projection probably is most valuable as an approximation rather than an exact forecast.    

The top for Micro W5 will also be the top for Minute W5 and thus Minor W3, so that event should mark an intermediate term top and lead to the most serious selling that's been seen since the lows of last November.

Sunday, May 5, 2013

Sunday, 5/5/13 update

This site has long favored the view that the equity bull market since the Mar '09 low is in fact an "X" wave between long term bear market sequences.  However, with the strength in equities of recent, and most particularly with the strong penetration of the 1600 level by the ES/SPX this last week, that view has diminished considerably in probability.  Back in 2009 and 2010 the chart pattern in the ES/SPX just did not look impulsive on the long term, which helped fortify the argument for an "X" wave in progress.  But now it's beginning to gain a very impulsive look.  So, with reluctance, the long term bull alternate has to be elevated to preferred status with the "X" wave bear a distant second possibility.

In addition, in the EW count on the bull alternate the series is actually only a little past the mid-point of the series developing from the Mar '09 lows, at least in EW terms.  Which is to say it's in a Minute W5 of Minor W3 of Intermediate W3 of Major W3 of Primary W3 of Cycle W1.  This would be the mid-point from an EW count standpoint, not necessarily the mid-point in terms of price or time, but it does imply a significant amount yet to be accomplished before a significant long term top. 

Long term preferred bull alternate

The ES/SPX should however be closing in on an intermediate term top.  The current Minor W3 dates back to the lows of last mid-November and is thus getting pretty long in the tooth.  Price is also getting very near to the assumed upper trendline of the channel that currently defines Primary Wave III.  And finally, if correct, the EW count on Minor W3 looks to have Minute waves 1 to 4 complete with Minute W5 in progress.

Minor W3 - internal EW count

The above count needs to be taken with a grain of salt - Minor W3 has extended several times to this point as it has continued to truck on upwards, so it's certainly possible for it to continue doing just that. 
But if the above Minor W3 count is accurate, then it also is the case that the current Minute W5 is just past it's mid-point and thus an intermediate term top is quite likely before the end of the month. Current likely target area for that top is in the ES 1645 - 1650 area.

Minute W5