CURRENT CHARTS


Click HERE to view current charts


Wednesday, March 30, 2011

Wednesday 3/30/11 wrap up

Looks like a 5th wave done or almost done on ES/SPX today.  But it's only a sub-wave to Micro W3 of Minute W3, so any selling should be corrective and short lived.

ES - 2 hour bars

AUD/US$
The AUD has been in a bull market since the end of last May,  with a strong run up occurring from early Jun through early Nov, and then a lot of sideways action into the low two weeks ago.  There's been a nice rally since then, but by the preferred count below it is in a Minor W5 and is quite possibly close to the conclusion of that wave.  If this count is correct, the AUD should roll over soon into a correction that will carry back down to the area of previous wave 4 lows.  That area is between .9600 and .9800.

AUD - daily

AUD - hourly

There is an alternate in the AUD which is more bullish.  That count has Minor W5 and thus Intermediate W1 complete at the highs of early March with the low two weeks ago labeled as Intermediate W2.  In both counts the move up from the low is nearly complete, the difference in the alternate would be the extent of the correction to be expected when that move does roll over.  Under the alternate it would much more shallow and shorter in duration.

AUD - daily - alternate

Tuesday, March 29, 2011

Tuesday 3/29/11 wrap up

ES shook off yesterday's late selling and mounted a nice rally today.  If my bullish count is correct, we are in a sub-wave 5 to a Micro W3 of Minute W3 of Minor W1 - in other words, more upside ahead but probably a little choppy  as the ES completes a series of 4th & 5th waves.

ES - hourly


Gold
The bullish view on gold has it in a Minor Wave 5 (red) up from the late January lows, with a Minute W1 & W2 (green) complete by mid March and Minute W3 in progress.  Minor W1 occurred in 2009 and was around $325 in length, so Minor W5 could reach into the 1630 area from the Minor W4 low of 1309.

Gold - daily - bullish alternate

Gold-hourly

If the bullish count is correct then the selling of the last few days is just a speed bump and we should start moving steadily up fairly soon.

The bearish alternate has gold still working it's way through a Minor W4 correction that is taking the form of a flat.  In that correction waves "a" and "b" are complete and wave "c" is in it's early stages.  In this alternate wave "c" started at the high of last Thursday and has a downside target of at least the wave "a" low of late January at 1309.  At this point the bearish alternate is less credible because the pattern down from last Thursday looks much more corrective than impulsive.

Gold - daily - bearish alternate

Monday, March 28, 2011

Monday 3/28/11 wrap up

Snoozer today in the ES until the last hour when it took a sharp slap in the face.  At least that's what it felt like, but on review the fact is the ES was only down 8.50 points - not exactly earth shaking. 
The bull count here is that the end of day selling was the 4th wave in a Micro Wave 3 (black).  If so, prices should turn up pretty quickly.

ES - 2 hour bars - bullish count

If the action at end of day was the start of some serious selling, then the ES most likely has just completed an "X" wave and is embarking on a 3rd zig-zag formation down from the highs of Feb 18.

ES - 2 hour bars - bearish count

Saturday, March 26, 2011

Weekend Update 3/26/11

Vacation earlier this month and business issues since then have kept me from posting a lot, hopefully things will ease up soon.

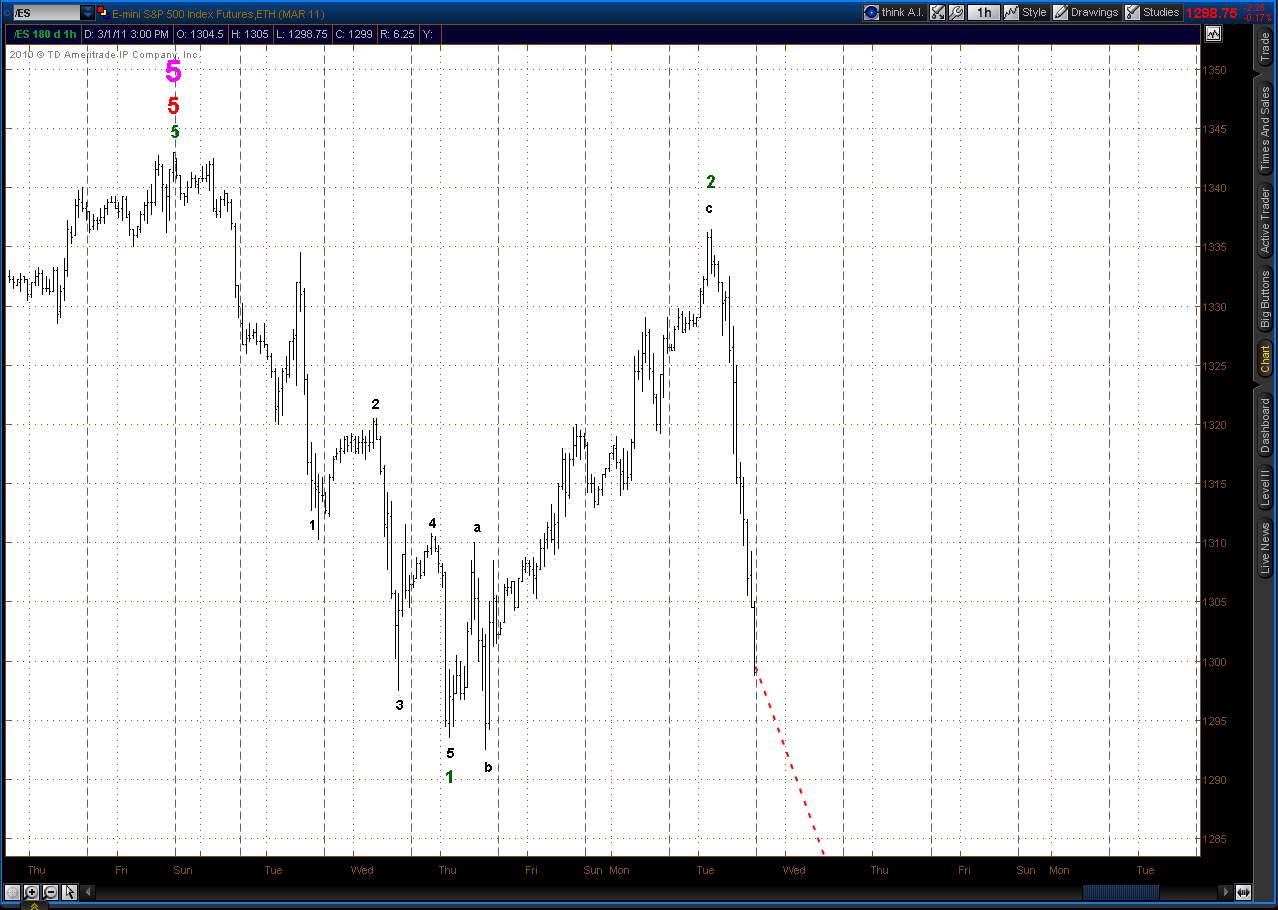
The ES almost certainly saw a bottom to it's correction on Thursday Mar 17.  The pattern from the top on Feb 18 into the Mar 17 low counts best as a double zig-zag.  Since then it looks like it's put in a series of wave 1 - 2 sequences of ever lower degree, so it's quite possible that the ES could accelerate upwards in the very near term.

ES hourly

ES daily

An alternate count here is that the Mar 17 low was only the 1st leg in a more lengthy correction to the preceding seven month bull market.  A likely possibility given action since that low is that the ES is tracing out a flat type correction. In that scenario prices would get turned back in the area of the mid February highs which would mark the conclusion of the 2nd "B" leg of the sequence.  Following that prices should plummet sharply in the final "C" leg of the pattern.  Although this alternate doesn't seem likely given the strength of the rally since the Mar 17 low, it became more plausible recently with rumors of possible Fed Reserve tightening and thus higher interest rates.

ES daily - alternate count

Silver
Silver futures (SI - regular, not mini) has become my favorite recently.  The ATR on that contract is currently running around 1.15, which means the average range from high to low on any given day is about $1.15 per ounce, and with the SI contract at 5000 ounces that means that the dollar value of that range is $5,750 per contract.  So if you can catch just half of that daily travel you can pocket $2,875/contract.  Not bad.  The margin on SI is pretty steep at over $11k/contract, but if you've got the equity and can stomach the risk the ride can be fabulous.  For lower risk the mini-silver contract can be traded, symbol is "YI" and I believe that contract is for 1000 ounces.  But it's a thinner market which could potentially effect the ability to fill an order, plus it trades less hours than the SI so there's the danger of adverse movement in the SI causing a gap open against a YI position which you are powerless to do anything about.  So in my mind the risk is higher with the mini even though the contract size is much smaller.

Silver has been on a bull market tear since last fall, moving up from a low of around $17.50 to a high last Thursday of $38.18.  My preferred count is that SI put in a Minor Wave 5 (red) high at $36.745 which marked the conclusion of an Intermediate Wave 3 (purple) sequence dating back to a low from July, 2009.  If so, that Minor W5 traveled a distance almost exactly equal to a .618 multiple of Minor W3.  The corrective sequence that followed also confirmed that idea in the sense that it was a flat which alternates with the zig-zag type Inter W2 correction of mid 2009.  Thus the low of the correction on Mar 15 would be Intermediate W4, and SI has been tracing out Intermediate W5 since that time.  It's also important to note that Intermediate W5 may have concluded at Thursday's high - Intermediate W1 in 2009 traveled $4.525, and at Thursday's high Intermediate W5 had traveled $4.615 - awfully close to equal.

SI - daily

 The alternate in SI is that Minor W5 is extending and that the early March top and subsequent correction were only Minute Waves 1 & 2 of Minor W5.  If that's the case, there's a LOT more upside left in SI.  Doesn't seem plausible, but it's certainly possible.

SI daily - alternate

Tuesday, March 22, 2011

Tuesday 3/22/11 wrap up

There's a fair chance that we've seen the end of any serious selling for a while in the ES/SPX.  Elliott count looks like a double zig-zag from the top of Feb 20 into the low of Mar 16.


If the correction is over it's been pretty shallow - not even a .382 retracement of  the preceding 7 month rally.

Tuesday, March 15, 2011

Tuesday 3/15/11 wrap up

Best guess on the current count on ES is that we're nearing the end of the move down from the end of the Minor Wave "b" triangle on Mar 8.  This count shows the ES to be in Micro W5 (black) of Minute W5 (green).  Again it is possible that we are nearing the end of the correction from Feb 18 top, but it's also quite possible that there's a lot more yet to come - see yesteday's post.


I've just been on the run since back from vacation last week, and am on the road on business tomorrow & Thursday and for personal on Saturday so won't be posting much.

Monday, March 14, 2011

Monday 3/14/11 wrap up

ES/SPX
Since the Major W1 top of Feb 20 the ES appears to have put in a Minor Wave "a" and "b" leg of the correction, with the "b" leg taking the shape of a triangle in the ES terminating on Mar 8.

ES hourly

5 waves can be counted as complete from the end of the triangle on Mar 8 into the the low last Friday.  It is thus possible to label that low as the end of Minor Wave "c" and declare the correction to be over.  However, if the long term count presented below is right, the ES is correcting against an almost eight month rally and has only retraced around 20% of that move.  So although it's certainly possible that prices will start a new rally sequence from here, it's not all that probable.  If we do resume the selling, likely targets are the .382 and .500 retrace levels at ES 1213 and ES 1173 respectively.  ES 1173 has a high probability as it marks the area of prior Intermediate and Minor Wave 4 lows.

ES daily

Tuesday, March 1, 2011

Tuesday 3/1/11 wrap up

LOOK OUT BELOW!!

ES daily

ES hourly

I'm leaving for a short vacation tomorrow, back Tuesday Mar 8, but will be monitoring things while gone - plan on holding short ES's, could pay for the trip (and then some).