CURRENT CHARTS


Click HERE to view current charts


Tuesday, August 31, 2010

Tuesday 8/31/10 wrap up

Today has been officially designated "Pain In The _$$ Market Day".  Whole lotta back and forth today, no significant new information.  Looked like the guys in the pits were playing ping pong with the 'bots.

This is beginning to look suspiciously like we're putting in a bottom.  We've bounced off ES 1037 three times in the last 5 days, obviously that level needs to be penetrated.  My guess is that if we break below that we'll break down hard.  Meanwhile that level has turned into significant support. 
Current preferred (bearish) Elliott count: 

The Trendline and the Dynamic Oscillator in the Trend/Osc system re-set when we touched last night's low of ES 1037.50, however the Dyn Osc once again poked above the 20 line today.  (Note: TOS for some reason drops much of the data from the last couple days if set to an hourly bar, but I discovered after the close that it works just fine with a 30 minute bar, so that's the chart format below).  The Stop & Reverse has been moved lower to 1066.50 which is just above the down trend line, otherwise still holding short ES from 1085.00.

Monday, August 30, 2010

Monday 8/30/10 wrap up

As anticipated, the Trendline/Oscillator system generated a Buy signal last night within the 1st hour when prices closed above the down trend line.  Also as anticipated the market peaked overnight and rolled over, so the plan to not act on that buy signal has worked out.  If the ES reaches the prior low of 1037 then the down trend line will be re-set as per the red line on the chart and a whipsaw will have been avoided.
 

The tendency towards whipsaws in the Trend/Osc system has been it's weakness, and the plan to use Vindicator signals to enhance the system worked well in this case.  With the 30 minute V Stoch at overbought levels on Friday it was a fair bet that action on any buy signal off the Trend/Osc should be delayed pending a down turn today, which was exactly the right read.  Currently the 30 minute V Stoch is drifting down towards oversold territory but is not there yet. Interestingly the Sell line in the Buy/Sell Vindicator started showing signs of life towards the close.
 

Current preferred Elliott count:


 There is a bullish alternate still to be considered, hourly chart looks like this:

There is a problem with this count, and that is defining the action of last Wednesday through Friday.  To fit Elliott rules that period is best labeled as a 4th and 5th wave, but the 4th is obviously not a flat and can't be a zig zag, so it has to be a 5 wave triangle (wedge).  But to get that out of the pattern is very awkward as can be seen on a 5 minute chart:


Which is why the pattern for that period is best interpreted as a flat and thus why the bearish count is preferred.

Still holding short ES from 1085.00 with S&R currently at 1070.50.

Sunday, August 29, 2010

Sunday 8/29/10 update

ES is in "ramp up Monday" mode.  Changed the Stop & Reverse @ ES 1075 to a straight Stop Loss @ 1075, the way things look right now the ES is likely to hit that level but I'm fairly certain of some sort of pull back Monday or Tuesday.  Will re-assess in the morning.

Saturday, August 28, 2010

Weekend Update 8/28/10

We are at a most interesting market juncture.  Friday's action was certainly surprising and unanticipated for many people, myself included.  But I guess that's in the nature of things, markets tend to do what's least expected. But the net effect at this time is to put the bear case on a little less solid footing.
I believe the best place to start with analysis is a close up look at a 5 minute chart of the ES for Wednesday through Friday.  It shows a textbook Elliott wave 3-3-5 flat correction pattern.  The great thing about flats as opposed to zig zags is they are very clearly a corrective pattern against a primary underlying trend.  A zig-zag can morph from 3 waves into 5 and thus become the 1st wave of a new direction, with the news that there is a change in trend not apparent until that 5th wave has been established.  Flats END with a 5 wave move, so the 5th wave of the flat's C leg terminates the correction.

Zooming in on Friday's action there is a clear 5 wave pattern complete with a diagonal 5th wave bear flag type structure.  Of course that count won't be confirmed until and unless the ES almost immediately turns down, but it looks pretty certain at this point.


It's when we zoom out to a broader perspective that the picture get's hazier.  First off, the preferred count discussed in the daily posts this week I believe is off the table at this point.  There are two likely bearish counts IMO, they differ in terms of wave degree.

BEAR ALTERNATE 1

BEAR ALTERNATE 2

There is a bullish alternate, daily chart of that possibility looks like this:


There are many factors arguing against the bull count.  First, as has been mentioned repeatedly in recent weeks, volume is sorely lacking over the last month or so.  Second, the Wave 2 shown as just completed retraced about 75% of Wave 1 which is quite a bit and pushing the limit of what is probable.  Thirdly, I keep a set of half a dozen proprietary daily indicators based on a/d, volume, put/call and other statistics and they are mainly bearish with a couple neutral and none clearly bullish.

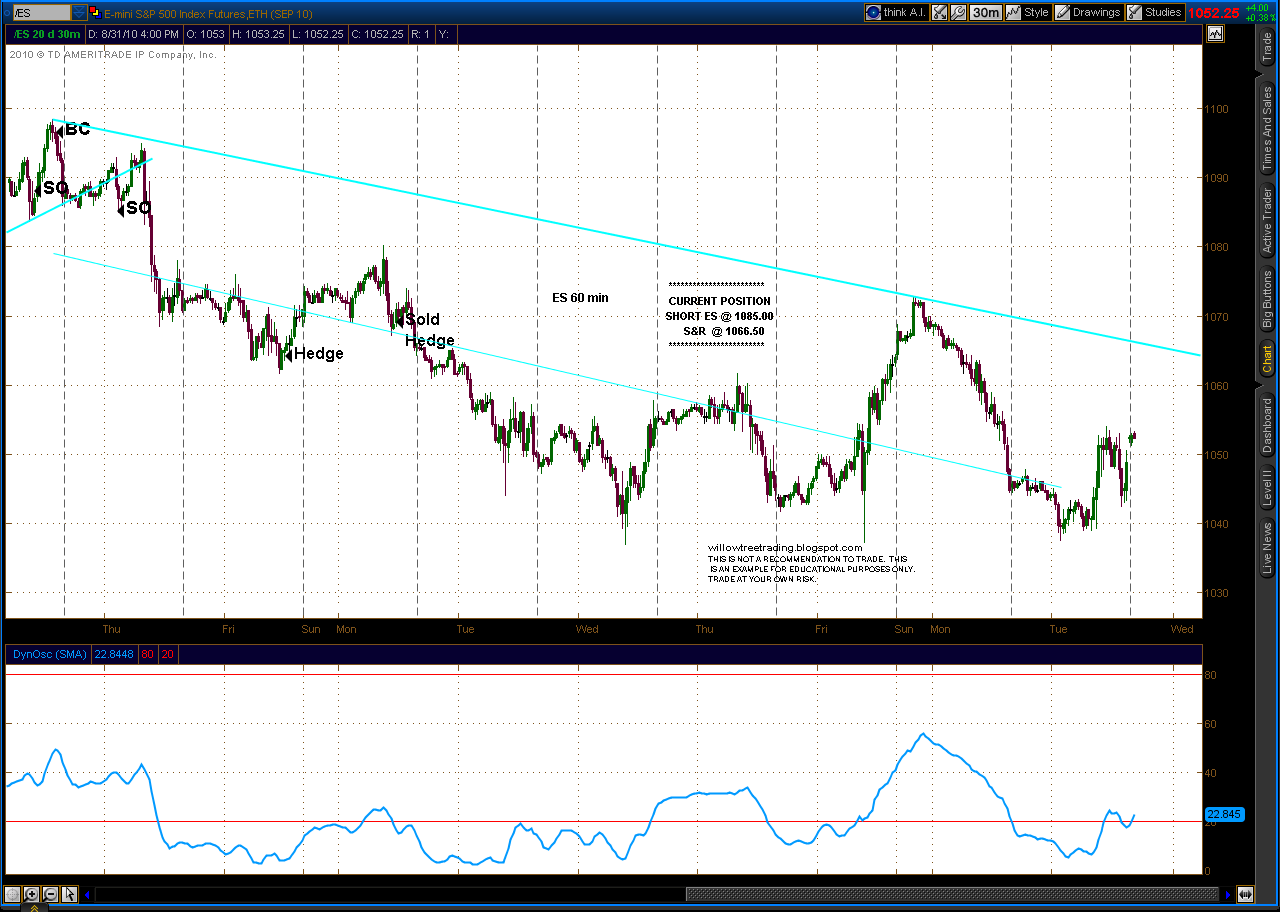
From a near term trading standpoint still holding short ES from 1085 but we are on the very edge of a buy signal on the Trend/Osc system. 

The Dyn Osc popped up over the 20 level on Friday and prices are very close to breaching the down trend line.  If there is an hourly close above that down trend line it will constitute a buy signal under the Trend Osc system.
As mentioned earlier, prices painted a nice little bear flag in the last half of the day Friday.  Also, we were overbought at the close Friday.  The 30 minute V Stoch is in sell territory at the close and the Buy line in the Buy/Sell Vindicator has flattened out around the same levels it was at on Aug 17 and 18 before the ensuing sell off.

If the ES continues it's uptrend overnight on Sunday and triggers a Trend/Osc buy signal I believe the correct action is to delay a position reversal from short to long pending a probable move down at some point Monday.  The 30 minute V Stoch will key my decision making - if it and thus prices do in fact roll over preceded by a buy signal on the Trend/Osc then a reversal to long ES will wait until the V Stoch gets into buy territory around the 20 level.  Alternatively, the Stop & Reverse at ES 1075 will be maintained and if hit the other considerations become moot.

Thursday, August 26, 2010

Thursday 8/26/10 wrap up

Steady down today after a corrective looking drift up overnight capped by a nice little sell off into the close of regular trading.  However, the question posed yesterday remains unresolved, i.e. was the 5 wave sequence down that concluded yesterday a wave 3 or wave 1 of an extended wave 3.  I believe we'll know the answer within the next few days, possibly tomorrow.

The Vindicator was not working Monday due to problems in the data feed at TOS.  They got that fixed on Tuesday so that it was running real-time, however data from Monday was missing until today.  So we finally have Vindicator charts with continuous read outs for the week.  Unfortunately in studying them the information doesn't appear to be of much use.  The Buy/Sell lines have converged over the last few days and are not showing signs of any real push in either direction.  The V Stoch muddled around in mid-range Tuesday and Wednesday, and today it fell from near overbought territory to near oversold territory, but it isn't and hasn't been really ringing the bell either way.

Still holding short ES from 1085.00.

Wednesday, August 25, 2010

Wednesday 8/25/10 wrap up

Current ES wave count looks like 5 waves down from Monday's highs were complete this morning.  The question here is whether this concludes wave 3 of the move down from Aug 18 or if it's only wave 1 in an extended wave 3.  It's traveled far enough to qualify as a wave 3 under Elliott rules, but it just seems to have lacked the punch normally associated with 3rd waves.

There are alternate bullish wave counts here, but they are awkward.  The biggest factor buttressing the bear case continues to be the lack of volume.  The effect is the same whether due to late summer vacations or lack of interest by potential buyers.  Volume has picked up marginally in the last two days, but it's still in the tepid area.

Still holding short ES from 1085, adjusted the S&R to 1075 towards the end of the day.  The Dyn Osc is poking above the 20 line, but until and unless there is an hourly close above the down trend line (thick blue line on chart) the short position will be maintained (barring an unlikely overnight stop & reverse).  Jobs report tomorrow morning, possibly we'll see a strong gap down open to kick off a 3rd of a 3rd down.

Tuesday, August 24, 2010

Tuesday 8/24/10 wrap up

Current Elliott count:

Still holding short ES from 1085.00

Monday, August 23, 2010

Monday 8/23/10 wrap up

Current Elliott count ES hourly:
Starting to scare myself with the projections made last Thursday (red dashed lines).  Spooky.

Longer term view (ES daily):

There is an alternate bullish count which says that the highs of Aug 9 mark the end of a Wave 1 up and that the selling since then is a Wave 2 correction.  If that's the case we've already retraced 50 % of that Wave 1 at ES 1065.  The fibonnaci  61.8 level is around ES 1050 and the 78.6 is around ES 1029, so those are levels to watch.  Volume continues weak so the bullish argument continues to lack credibility IMO.

ALTERNATE BULLISH COUNT

The SPY Oct Calls that were bought Friday for a hedge against the short ES's were sold this morning. Still holding short ES from 1085.00.  The Stop & Reverse has now been moved to ES 1085.00 as well.  Will continue to hold short as long as prices continue to trade below the down trend line (thick blue line).

One final note: TOS had problems with it's data feed from the NYSE today.  The Vindicator is based on certain NYSE statistics and thus was not updating due to the TOS problem.  Hopefully that will be resolved by tomorrow.

Friday, August 20, 2010

Friday 8/20/10 wrap up

Here's the chart of the preferred count from yesterday's post with the projected action still on it and of course today's prices.

I like to think I'm pretty good when it comes to markets, but believe me I'm not THAT good.  I do get lucky once in a while though.  Anyway, we have a clear and completed 5 wave pattern down from Wednesday's highs, so it's pretty certain that Wave 2 (red) is over and we've just seen the end of subwave 1 (green).  Soooooooo, after a little bit of corrective rally on "ramp up Monday" we should roll over into a wave 3 of 3 down.
Longer term perspective looks like this (ES daily chart):

If we are in fact seeing Major Wave C or 3 (blue) this leg will equal Major Wave A or 1 at ES 949.50, so that's a first target.  FYI a 1.618 relationship comes in at 838.25.

Still holding short ES from 1085.00 per the Trend/Osc system.  However, did hedge the short ES with some SPY OCT 108 calls around 11:30 AM today - hate holding short over the weekend into "ramp up Monday".  The problem with using SPY is that it doesn't open again until Monday morning, so there's a possibility of a move against the position overnight Sunday in the ES, but it's a hedge so that doesn't mean potential losses but rather lost profit opportunity.  At any rate, the odds of continued rally into Monday morning are fairly good IMO.

Thursday, August 19, 2010

Thursday 8/19/10 wrap up

There are two near term Elliott possibilities here.  The 1st one has Wave 2 ending at yesterday's highs and a Wave 3 underway.  The internal structure of Wave 2 is a little awkward, but it works. That's the preferred count (since I'm short ES lol). 

However, as of this writing the move down from yesterday's highs only has 3 legs, so we've not yet seen 5 waves down from yesterday, nor have we traded below Monday's lows. Thus from an Elliott standpoint it's not certain that Wave 2 was over at yesterday's highs.  Rather, the selloff late yesterday and today could be the "B" wave of a flat type correction, with one more "C" wave rally in the offing before Wave 2 is finally done, as per following:

The Trend/Osc system generated another sell signal last night at 7 PM (CST) with ES at 1085.75.  However, it looked like the market might rally overnight (Asian markets were strong) so a sell on stop at ES 1085.00 was placed.  Some frustration here, because I set a target of 1093.00 to go short and could have set up an OCO (one cancels the other) to sell on stop at 1093.00 or 1085.00, but there is no way to automatically have a stop placed on an OCO order, i.e. if either end of the OCO was hit the position would be on without stop loss protection.  I won't work without a net, so I decided to go with the sell on stop at ES 1085.00 with automatic stop loss placed on that position at 1105.00 if it was executed.  As it turns out, the market rallied to exactly 1093.00 at 2 AM and then proceeded to immediately drop to 1085.00 at 2:36 AM at which point the sell on stop was executed.  Frustrating.  Anyway, still short from ES 1085.00 and holding.

Wednesday, August 18, 2010

Wednesday 8/18/10 wrap up

My Elliott count yesterday looked to easy, turns out it was.  The pattern now looks very much like 5 waves up from Monday's lows, which likely makes it wave A of a correction.  The alternative is wave 1 of a new rally sequence.

The Trend/Osc system gave a sell signal last night when the Dyn Osc dropped below 80 and prices closed below the trend line, ES was shorted this morning as a result.

However, prices rallied up to yesterday's high this afternoon, which reset the trendline and the Dyn Osc and the short ES was liquidated as a result.

Still looks like a bearish situation to me, but we may need a little more corrective rallying for the next day or two.

Tuesday, August 17, 2010

Tuesday 8/17/10 wrap up

Nice ramp up today.  But also steep ramp down into the close.  If the following Elliott count is correct it almost seems to easy, but also if it is correct we will be heading south with authority soon:

Volume yesterday was really weak and today was better but still tepid.  As has been mentioned in recent posts, it's hard to see how any kind of rally can be sustained without participation.  So if today we didn't see the end of the up move off yesterday's lows, it doesn't seem likely that any further rallying could have any durability.

The Trend/Osc system generated a buy signal in overnight action (3 AM) last night.  However, it is close to generating a sell signal at the moment and might do so by tomorrow morning.

Monday, August 16, 2010

Monday 8/16/10 wrap up

Current Elliott count, ES hourly & daily :


The ES low tick today (1066.25) was 1 point off of an exact 50% retrace (1065.25) of the rally from Jul 6 to Aug 9.  That tends to verify the thought that we've completed 5 waves down from the Aug 9 highs.  Which puts us in Wave 2.
Duration of Wave 1 was roughly 6 days, so Wave 2 should be about the same or (probably) less.  This dovetails nicely with the usual bullish action of OPEX week, i.e. once OPEX is over on Friday that lift will be gone and we could well see the resumption of the bear market.

Meanwhile, the Trend/Osc system could generate a buy overnight or tomorrow if prices break above the down trend line (thick blue line) and the Dyn Osc breaks above 20.  If so it would be a risky long IMO.

The Vindicator lends credence to the near term bullish case with the Buy line above the Sell line and the V Stoch down in buy territory.

 So long might be the right place for right now, but it would be a nervous long.

Monday 8/16/10 Update

We have a possible ending diagonal 5th wave complete this morning on the move down from the Aug 9 highs.
(on ES)

Saturday, August 14, 2010

Weekend Update 8/14/10

Current ES Elliott count, hourly chart:

ES Elliott count, Daily chart:

Note that Fibonnaci extensions project out to ES 949.50 for C=A and 838.25 for C = 1.618 x A.

Came very close to shorting ES at around 1082.00 Friday afternoon, chose not to for three reasons:
1) "Ramp up Monday" pattern that has been evidencing itself in recent months;
2) Next week is OPEX week which is typically bullish;
3) Weekend events can cause unfavorable Sunday night gap openings.

However, the market still looks extremely weak so I will pay close attention to the open Sunday night and may monitor things much more closely than normal into the evening.

Thursday, August 12, 2010

Thursday 8/12/10 wrap up

Preferred EW count looks like this:

The Intermediate Term bullish alternate cannot be completely ruled out as of yet, that idea would say that the diagonal 5 wave move up from the Jul 6 lows at ES 1002.75 is not an ending diagonal but rather a Wave 1, with a Wave 2 correction underway.

From the standpoint of Elliott wave rules this bullish alternate cannot be discarded unless and until the ES prints below the Jul 6 low at 1002.75.  But as a practical matter it's hard to give this bullish scenario any more than a low level of probability for the same reason that the rally leading into Monday's top was suspect:   low volume.  It's hard to see how this could be a correction in the early stages of a bull phase if there is no participation.  I think it's important to note that Wednesday's sell off was relatively low volume as well.  A true bear market is characterized by an evaporation of buyers.  

I know the Vindicator is my own creation, but I'm still undecided as to it's utility.  However, on review it's obvious that the Buy/Sell Vindicator was signaling the topping process that occurred in the last couple of weeks.  Note how the Buy line (green) diverged against prices coming into Monday's highs, clearly showing the waning of buying pressure:

Wednesday, August 11, 2010

Wednesday 8/11/10 wrap up

Wow. The confusing picture from earlier this week has certainly been resolved.  Current Elliott count looks like this:

In this count we are embarking on a 3rd or C wave down, doesn't matter which at this point because the main message here is a strong down stroke that should carry some distance. Wave "A or 1" traveled an ES 180 points, an equal distance for this Wave "C or 3" would give us a low of 947.75 from  last Thursday's high of 1127.75.

Got stopped out of the long ES from Monday early this morning at ES 1103.75.  I broke my own rules here and am paying the price.  The Trend/Osc system calls for Stop & Reverse on all positions rather than straight Stop Losses, that feature is there for just this type of situation.  For reasons that seem entirely and obviously ridiculous in hindsight I changed the Stop & Reverse to a straight Stop Loss yesterday.  If I had followed the system rules I would be short ES right now from 1103.75 and feeling pretty good, with the loss from Monday's long ES more than covered and obvious potential for a lot more gain.  Sigh.  Sometimes a trader can be his own worst enemy.

Tuesday, August 10, 2010

Tuesday 8/10/10 wrap up

Pain in the --- market the last few days, not impulsive down but not impulsive up either, no real trend is evident.  A break of the upper or lower trend lines in this ES chart will probably decide one way or the other:

There are two Elliott counts which seem most probable at the moment, and they both call for up prices in the immediate future.
BULLISH
 

BEARISH

Monday, August 9, 2010

Monday 8/9/10 wrap up

Another low volume day, in fact last time volume was this low was the last week of December.  I still believe that a sustained rally is hard to envision at this point unless participation picks up.
The Trend/Osc system gave a buy signal today so the short ES's from Thursday were covered at a 6.75 point loss and a long position established.  The Trend/Osc system has a tendency to cause position whipsaw at times, and this is the type of situation in which that can happen.  However, the Buy line on the Vindicator Buy/Sell line continues to track well above the Sell line, so maybe long is the place to be.