
Wednesday, December 29, 2010
Wednesday 12/29/10 update
Revised Elliott count on ES - if this is correct, we are in Minute W4 (green) with a Minute W5 yet to occur to complete the move up from Nov 29 as well as the Intermediate Wave move from the Jul 6 lows. This would fit very nicely with seasonal patterns.

Tuesday, December 28, 2010
Tuesday 12/28/10 wrap up
Are we there yet? Are we there yet? Are we there yet?
It's possible to count a completed 5 waves up from the late Nov lows at today's high.
 If this count is accurate we should see follow through selling overnight or tomorrow.
However, and as has been pointed out, a lot of folks are calling for a top and a correction in here, which mitigates against that happening.
If we continue the upward march, then the above count will have to be revised considerably. The troublesome thing from an Elliott standpoint is that outside of the strong impulse up of early Nov the rally patterns have been choppy and more 3 legged than 5. More befitting an ending diagonal. Which is the way Minute W5 (green) is counted in the above chart.
It's possible to count a completed 5 waves up from the late Nov lows at today's high.

However, and as has been pointed out, a lot of folks are calling for a top and a correction in here, which mitigates against that happening.
If we continue the upward march, then the above count will have to be revised considerably. The troublesome thing from an Elliott standpoint is that outside of the strong impulse up of early Nov the rally patterns have been choppy and more 3 legged than 5. More befitting an ending diagonal. Which is the way Minute W5 (green) is counted in the above chart.
Monday, December 27, 2010
Monday 12/27/10 wrap up
Buy signal today on EUR hourly Trend/Osc. The slow downward drift last week looks very much like basing activity, so this buy signal today could be a good one.

Elliott counts are awfully muddy everywhere I look, nothing that I have enough confidence in to post. ES continues to do the end of year upwards grind. Very low volatility - coiling for some big moves past the turn of the year I believe.

Elliott counts are awfully muddy everywhere I look, nothing that I have enough confidence in to post. ES continues to do the end of year upwards grind. Very low volatility - coiling for some big moves past the turn of the year I believe.
Thursday, December 23, 2010
Thursday 12/23/10 wrap up
Couple of ideas on the ES, neither one is high confidence:
Alternate #1

Alternate #2

MERRY CHRISTMAS!!
Alternate #1

Alternate #2

MERRY CHRISTMAS!!
Tuesday, December 21, 2010
Tuesday 12/21/10 wrap up
ES is still grinding upwards. It's possibly putting in an ending diagonal Minute W5 (green) as the last leg of Minor W5 (red) which is itself an ending diagonal.

If this count is correct the ES shouldn't go up past 1252.50. This is because Minute W1 was longer than Minute W3. Elliott rules say a 3rd wave can't be the shortest, so Minute W5 (now in progress) can't exceed the distance of Minute W3. Adding the length of Minute W3 (11.75 points) to the low of Minute W4 at 1240.75 gives a limit of 1252.50.
There is another possibility here. Intermediate W1 lasted 25 trading days from Jul 6 to Aug 9 and took the form of a diagonal.

If Intermediate W5 were to run the same length of time it would terminate on Dec 31 - just about perfect to accommodate the normal holiday/end of year buying. Also, Int W5 already has an overlapping tendency, and it can be counted as a diagonal in progress going back to it's start at the lows of Nov 29. A projection based on these thoughts looks like this:

Note the similarities between the chart of Int W1 and the projected Int W5 - both start out with about 7 days of strong rally followed by a choppy overlapping upward drift. Interesting.
EUR
Quick update on the Elliott count on the EUR. It appears to be in a 5th wave to the move down from the Nov 4 highs.


Saturday, December 18, 2010
Weekend Update 12/18/10
ES is grinding higher, pretty typical of holiday markets. I've revised and updated the hourly ES wave count, red dotted lines are the projection from the update of last weekend:

As can be seen, looks like we're building a diagonal Minor W5 (red) with Minute Waves 1 thru 4 (green) complete and Minute W5 in progress. Also note the channel that delineates the upward drift that started at the Minor W4 low of Dec 3rd. This Minor W5 is in turn the end cycle of Intermediate W5 (purple). Fibonnaci targets for Intermediate W5 based on Intermediate W1 were ES 1218.75 (.382), 1233.50 (.50), 1248.25 (.682) and 1296.00 (1.00). The first two targets are obviously behind us, but the 1248 target is a short hop up from Friday's close. And it so happens that the apparent Minor W5 channel intersects that point early Monday morning at just about the point I drew in the projection last weekend. I'd be thrilled if this turns out to be accurate. Currently I have no position in ES, but I plan on shorting ES at right about that level Monday if things develop as per my projection.
The daily ES chart puts the whole rally from last summer's lows in perspective. A clear Elliott 5 wave pattern is apparent:

GOLD
Haven't talked about gold in a while. It's been in a downtrend since Dec 7. There are two viable alternates at this point.
Alternate 1

In this alternate an Intermediate W3 (purple) top was established at the Dec 7 high and we are in the beginning stages of an Intermediate W4. There are a couple of problems with this count. First is that Minor W5 (red) can be better counted as a 3 leg move than a 5, and it needs to be a 5 to be categorized as an impulsive 5th wave. Second is that the Minor Waves 1 thru 3 (red) were much more lengthy in duration than the ostensible Minor W4 and W5 labeled in November to early December. Minor W1 was 5 months, W2 was 2 months and W3 was 9 months, whereas in this labeling Minor Waves 4 and 5 are measured in weeks and only lasted about 1 month total combined. The daily chart gives a pretty good perspective of this:

Also note that the same duration observation made for the Minor Waves (red) can be made for the Minute Waves (green) of Minor W3.
Alternate 2

This is actually Daneric's count for gold (http://danericselliottwaves.blogspot.com/). I like it because it solves the problems noted with Alternate #1. In this alternate Minute W3 (green) tops in mid October, same as Alternate #1, but since then gold has been tracing out a triangle type Minute W4. In that structure gold is well into the final "e" wave with a conclusion for Minute W4 near at hand.
Daily chart for Alternate #2:

Both alternates fit well with current conditions - the US$ is an uptrend and that should put downward pressure on gold prices. So for the very near term it looks like the direction is down for gold. However, if the US$ continues in it's uptrend over the coming months it's hard to see how Alternate #2 could be accurate. But Gold is it's own animal, and it doesn't necessarily move in lockstep with the US$. Could be that a EUR crash will precipitate a "flight to safety" where both Gold and the US$ rally.
Friday, December 17, 2010
Friday 12/17/10 update
9:55 AM
Last night's buy signal on EUR canceled with print below yesterday's lows

9:00 AM
EUR has just been a whipsaw since the 1st of the month. Covered short EUR last night on a hourly Trend/Osc buy signal, made a profit but not what I thought I might. Did not go long, still might but am assessing. This might be a situation where the best strategy is to trade a breakout of the recent range.

ES has been tough as well. Don't have a position there, been waiting for a top that I believe is coming to go short. The pattern from an Elliott standpoint is difficult to label with any degree of confidence, below is my best shot.

What we're seeing is pretty typical of end of year holiday markets. Lack of participation and no definite direction translates into sideways sloppiness. Tough to pick a profitable direction.
Wednesday, December 15, 2010
Wednesday 12/15/10 update
3:35 PM
Humility lesson #763 today after bragging this morning.
With today's selling in equities combined with ramp up in the US$ and down in EUR there's a fair chance that the top was in yesterday on the ES.

Haven't shorted ES yet and am traveling tomorrow. Guess my laptop is going to get a workout.
8:35 AM
Sometimes I scare myself. Red dotted lines are projection from weekend update.

Sell signals overnight on EUR and AUD hourly Trend/Osc. I'm looking for a spot to short EUR but am being cautious.
Tuesday, December 14, 2010
Tuesday 12/14/10 wrap up
We may have seen the top in W5 today in the ES:

Alternatively today's action might just be a Minute W4 with Minute W5 yet to happen. That would probably carry us into the end of the week. Personally I believe this is more likely - it is Op Ex week and I believe that will support things until it's out of the way on Friday.

Equities are less likely to roll over if the currency markets don't co-operate. And it looks like that is shaping up. On the DX (US$ futures), it's very likely that the end of a down market was seen at today's lows. It appears that the move down from the highs of Nov 30 has taken the form of a double zig-zag, with the C leg of that formation done or very close to done. The lows of this retracement, if they hold, are almost exactly a Fibonnaci 38.2% of the rally from Nov 3 to Nov 30. A rallying US$ will be bearish for equities.

Following up on one of yesterday's comments, the EUR barely avoided a buy signal on the daily Trend/Osc. For part of the day it traded above the downtrend line delineating that market, but it fell back below that line in concert with this afternoons sell off. Not out of the woods yet, but if we fall away from here the downtrend will remain intact.

Meanwhile the EUR hourly Trend/Osc has been in buy mode but is itself approaching a sell signal.

I'm planning to short the EUR if in fact the hourly Trend/Osc generates a sell signal.
Monday, December 13, 2010
Monday 12/13/10 wrap up
ES
ES is tracking with the projection from the weekend post. If correct, Minute W3 is done at today's high, a W4 down and W5 up yet to go.

EUR
The EUR/US$ has been a bit of a whipsaw lately on the hourly Trend/Osc. Buy signal on Wed, Dec1, sell signal on Tues, Dec 7 and back to a buy today. The buy on Dec 1 was only good for a small profit (relative to what the trend/osc has been generating in the EUR) and the sell from Dec 7 was a loss.

The thing I'm noting here is that the daily Trend/Osc for the EUR is very close to a buy signal - a close above the downtrend line from the Nov 4 high will move this indicator to buy mode.

From an Elliott Wave standpoint I have the pattern down from the Nov 4 high labeled as an impulse wave with waves 1,2, and 3 complete and wave 4 in progress. However, the move up from the Nov 30 low is pushing the envelope in terms of time and distance if it is to be considered the 4th wave as proposed. The drop dead point on that idea is the low of W1 at 1.3569. All in all we are at a crossroads in the EUR.

Saturday, December 11, 2010
Weekend Update 12/11/10
Running a trading blog is a little like being an athlete - when you're wrong there's no hiding it. I was wrong in my analysis and wave count in Wednesday's update, so I've redone that count. It looks very much like the 5 waves down into Wednesday's ES low was the C leg of a (very) irregular flat Minor W4. Thursday and Friday were a choppy drift upwards that at this point are best viewed as part (or all) of an ending diagonal Minor W5. The conclusion of Minor W5 will also mark the conclusion of Intermediate W5 of the rally that started in early July. So some significant selling should ensue once Int W5 tops out. Of course, there is always the possibility that Int W5 will extend and we're only seeing the end of Minor W1 of Int W5. But there are any number of intermediate term technical indicators in an overbought situation right now. Thus an extension, although possible, does not seem probable.
ES hourly

ES daily

Next week is Op Ex week as well as quarterly futures expiration, which have tended to be bullish. Also, historical tendencies are for equities to rally into Christmas. So I'm not expecting any real fireworks for a couple of weeks.
ES hourly

ES daily

Next week is Op Ex week as well as quarterly futures expiration, which have tended to be bullish. Also, historical tendencies are for equities to rally into Christmas. So I'm not expecting any real fireworks for a couple of weeks.
Wednesday, December 8, 2010
Wednesday 12/8/10 wrap up
Except for a drop in the currencies and metals this morning pretty uneventful markets today.
On the ES, the drop down from yesterday's high of ES 1235 into this morning's low at ES 1217.25 was clearly an impulsive 5 wave move. Conversely the drift up today was choppy, overlapping and very corrective looking. So chances are pretty good that there will be further selling in the very near term (next day or two).

On the ES, the drop down from yesterday's high of ES 1235 into this morning's low at ES 1217.25 was clearly an impulsive 5 wave move. Conversely the drift up today was choppy, overlapping and very corrective looking. So chances are pretty good that there will be further selling in the very near term (next day or two).

Tuesday, December 7, 2010
Tuesday 12/7/10 update
4:10 PM CST
On ES/SPX, looks like the top is in to the rally that started last Tuesday. The question now is how much of a correction will we see? The answer is it depends.
We have been in Intermediate W5 of a bull run that started in early July. Intermediate W1 ran 23 days and covered ES 125 points. So far, this rally has gone 6 days and covered 23 points from the low of Intermediate W4, which was a triangle. So it's fair to think that Intermediate W5 is not yet over, and the top today was only the end of Minor W1 of Int W5. In that case, the selling should be limited by the lows of Minute W4 (green), which were in the ES 1213 - 1220 area, as per the highlighted section below:

If however we've seen the extent of Int W5 with today's top, then we're looking at a potentially much more serious bit of selling. Targets would be the fibonnaci levels between the early July lows and today's highs. The low on Jul 6 was ES 1002.75, today's high was ES 1235.00, a distance of 232.25 points (wow). Fib retrace levels are thus:
.236 = 1180.25
.382 = 1146.25
.500 = 1119.00
.618 = 1091.50
.764 = 1052.50
as per below:

One final note. On the way up the ES 1170 area was significant support/resistance, so if we are going to see a deep correction I would expect that area to once again come into play.
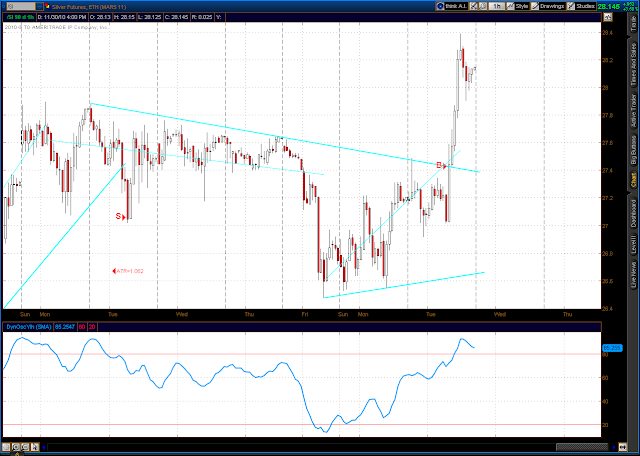
On Silver, there was a sell signal on the hourly Trend/Osc late today. I've been watching SI closely for a top, but the signal came at the end of an hour of deep selling so I'm holding off on a short there pending a decent retrace. If one doesn't happen I'll stand aside. I'm always weighing risk/reward, and that equation wasn't favorable enough for my liking when the signal was generated this PM.
9:25 AM CST
Couple of possibilities on ES currently:


Third possibility is that Intermediate W5 (purple) will extend, in which case we're only seeing last phases of Minor W1 (red).
On ES/SPX, looks like the top is in to the rally that started last Tuesday. The question now is how much of a correction will we see? The answer is it depends.
We have been in Intermediate W5 of a bull run that started in early July. Intermediate W1 ran 23 days and covered ES 125 points. So far, this rally has gone 6 days and covered 23 points from the low of Intermediate W4, which was a triangle. So it's fair to think that Intermediate W5 is not yet over, and the top today was only the end of Minor W1 of Int W5. In that case, the selling should be limited by the lows of Minute W4 (green), which were in the ES 1213 - 1220 area, as per the highlighted section below:

If however we've seen the extent of Int W5 with today's top, then we're looking at a potentially much more serious bit of selling. Targets would be the fibonnaci levels between the early July lows and today's highs. The low on Jul 6 was ES 1002.75, today's high was ES 1235.00, a distance of 232.25 points (wow). Fib retrace levels are thus:
.236 = 1180.25
.382 = 1146.25
.500 = 1119.00
.618 = 1091.50
.764 = 1052.50
as per below:

One final note. On the way up the ES 1170 area was significant support/resistance, so if we are going to see a deep correction I would expect that area to once again come into play.
On Silver, there was a sell signal on the hourly Trend/Osc late today. I've been watching SI closely for a top, but the signal came at the end of an hour of deep selling so I'm holding off on a short there pending a decent retrace. If one doesn't happen I'll stand aside. I'm always weighing risk/reward, and that equation wasn't favorable enough for my liking when the signal was generated this PM.
9:25 AM CST
Couple of possibilities on ES currently:


Third possibility is that Intermediate W5 (purple) will extend, in which case we're only seeing last phases of Minor W1 (red).
Monday, December 6, 2010
Monday 12/6/10 wrap up
Pretty uneventful day. The big question is have we seen the extent of the rally in equities? Don't know, my hunch is probably not, but I don't trade on hunches.
Current Elliott count on ES:
Hourly

Daily

Current Elliott count on ES:
Hourly

Daily

Thursday, December 2, 2010
Thursday 12/2/10 wrap up
Looks like we did in fact have a triangle Intermediate W4 which bottomed Monday. That puts us in the 5th wave of the rally that started in July.

The question now is how far and how long will it trend? The most obvious target is the Nov 9 top @ ES 1224.75 which is only inches away as I write this. That could well be it, classic Elliott theory calls for a short quick burst to the prior high when coming out of a triangle with a target around the preceding high. So this certainly fits. From a fibonnaci standpoint, Intermediate W1 traveled 125 points, so starting from the W4 triangle low @ ES 1171 a .500 of W1 lands @ 1233.50, .618 is 1248.25, and equality is at 1296.00 (we've already surpassed the .382 level @ 1218.75).

In the currencies, there looks to have been a MAJOR player in the market today, my guess is the central banks are coordinating to suppress the dollar to try to alleviate the EUR situation. Following charts are 15 minute bars of the EUR and AUD, I suspect you'll see the same pattern in other currencies that I don't follow.


I'd say this almost certainly is what central bank intervention looks like. At the risk of sounding cocky, I don't believe they can make a lasting difference in the currency markets, those are truly mammoth flows. So my finger is on the sell trigger in both the AUD and EUR - if they have to work this hard to push them the little bit that they did I believe the downside could be pretty powerful.
Wednesday, December 1, 2010
Wednesday 12/1/10 update
4:20 PM CST
Of the three possibilities for the ES presented earlier today, the 2nd one is pretty much now off the boards. I still am of the opinion that the third alternate is less likely and that we are in an Intermediate 5th wave holiday rally.
The EUR looks like it's done with it's most recent sell off sequence, but chances are this is a correction to an ongoing downtrend. The Daily Trend/Osc for the EUR is solidly in Down mode.

The Elliott count shows the EUR just completing either Minute W1 (green) of Minor W3 (red) or Minor W3 itself at last night's lows. From a practical standpoint the difference is irrelevant at this point, either way it looks like a correction that will provide an opportunity to re-load on short EUR. But the correction is important because it removes a bearish influence from the ES.

11:00 AM CST
3 possibilities here on ES:
#1 - Intermediate W4 triangle done at Monday's lows

#2 - D wave of Intermediate W4 triangle close to done, E wave yet to come before W4 complete

#3 - Flat correction to initial W1 down of early Nov in progress, C leg of that flat in progress to be followed by hard sell off in a few days. W1 down was a leading diagonal.

Tuesday, November 30, 2010
Tuesday 11/30/10 wrap up
The ES continues it's sideways drift of A-B-C's:

Meanwhile, the US$ keeps chuggin' ever upwards:

And the EUR continues it's fall off the cliff:

One observation here: the bullish dollar should be exerting strong downward pressure on equities, yet they are not breaking hard down. So if the US$ rally should pause, quite possibly equities might rally into the holidays, which happens to fit the seasonal pattern for equities.
After a Buy signal yesterday evening on the hourly Trend/Osc Gold went on a tear today. As before this is counter-intuitive : US$ and Gold rallying simultaneously. Got to be a flight to safety, and if that psychology turns Gold could be in for a heck of a dump. Meanwhile it's on the way up.

Silver is also on a tear, but a buy signal wasn't generated there until this morning.

Subscribe to:
Posts (Atom)
