CURRENT CHARTS


Click HERE to view current charts


Sunday, September 30, 2012

Sunday, 9/30/12 update

As outlined in last Tuesday's update, there is a way to count recent activity that has a significant long term top in place at the high of ES 1468.00 on Sep 14:


In this view the ES has put in a Cycle degree "X" wave from the Mar '09 lows in the form of a double zig-zag.  The "C" wave of the last zig-zag is an ending diagonal which terminated at that Sep 14 high.  As mentioned Tuesday, this interpretation is plausible but also questionable given the liquidity pump the Fed is operating these days.

The prime alternate at the moment shows the same basic structure since the Mar '09 lows but has the 5th wave of the ending diagonal "C" wave still in progress:

OR


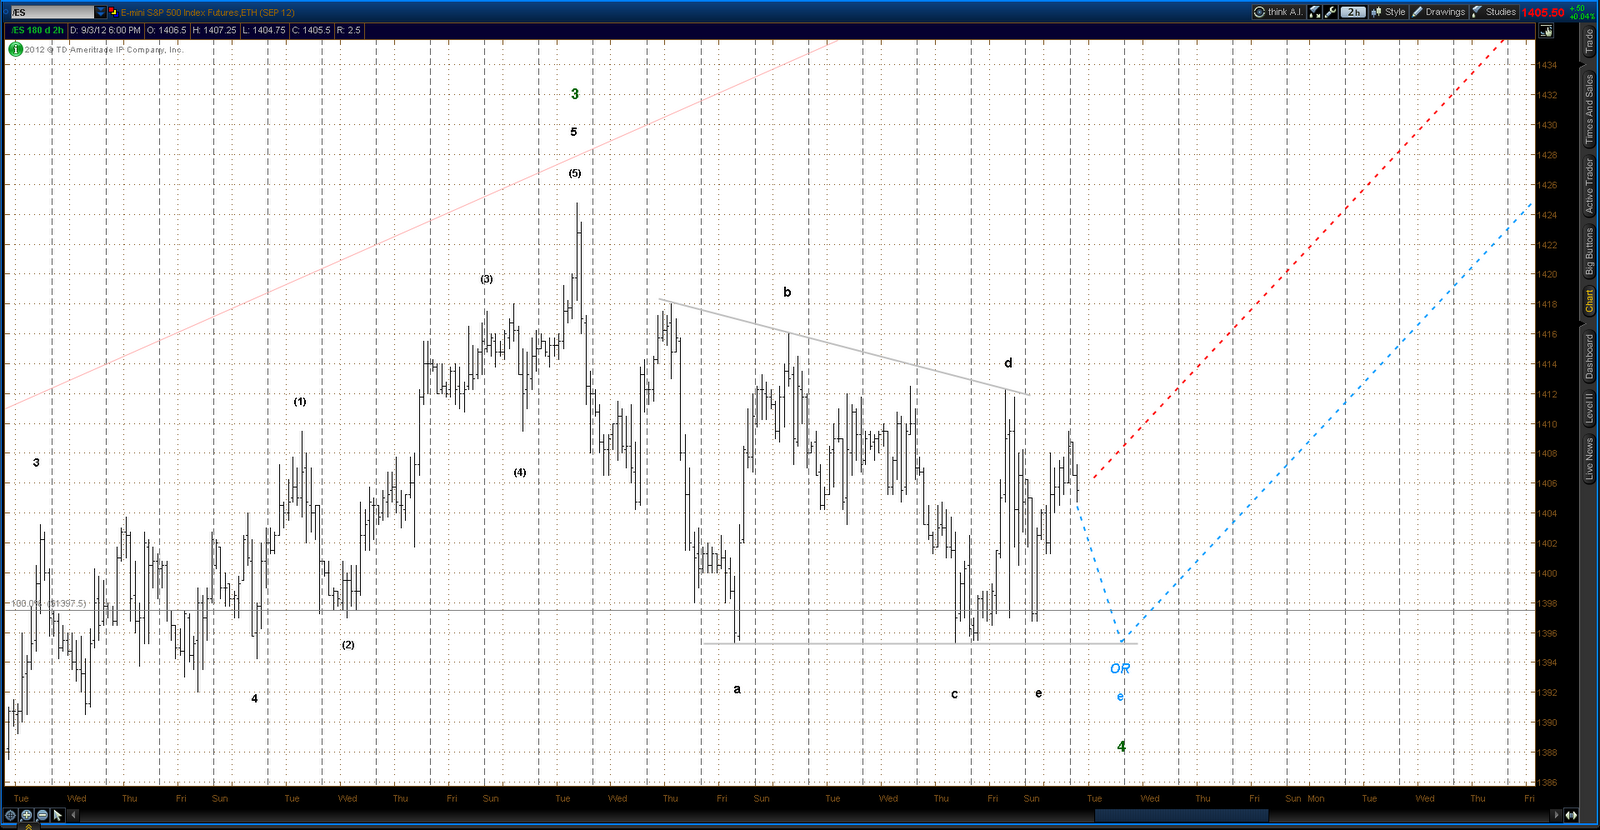
One possible way to help determine the true nature of the Sep 14 high is to examine the selling since that top too see if it's impulsive or corrective in nature.  If impulsive then the argument that Sep 14 marked a significant top is buttressed.  But that analysis doesn't throw much light on the situation as the selling doesn't appear complete at this point and it can be viewed either way - it can be labeled as an impulse in progress that has completed waves 1 thru 4 with wave 5 in progress or as a triple zig-zag with the "c" wave of the 3rd zig-zag in progress.

Impulse count

Corrective count

The next rally sequence will help tell the tale - if the ES rallies up past the 1468.00 high of Sep 14 then it's probably headed for the 1490 area and possibly much higher.

Al's Indicator
The reading on Al's Indicator dropped below 1.00 on Friday to a value of .88.  Readings below 1.00 have had a history of being fairly reliable buy signals.


Tuesday, September 25, 2012

Tuesday, 9/25/12 update

What looked like a triangle being formed in the ES yesterday now appears to be a double zig-zag:


Longer term view shows this as a 4th wave:


However, there is another way to count the latest sequence that arrives at the conclusion that THE TOP is in.  Not very likely given the Fed's determined pump priming, but here it is:


Monday, September 24, 2012

Monday, 9/24/12 update

Looks like quite possibly another triangle forming in the ES:


Sunday, September 23, 2012

Sunday, 9/23/12 update

The current count in the ES/SPX has it in Wave C of the second zig zag of a double zig zag bull market dating back to the Mar '09 lows.  This C wave dates back to the lows of last October and appears to be taking the form of an ending diagonal.


As can be seen, the count has the ES in the 5th wave of C with the start of Wave 5 at the low of Jun 4.  In equities 5th waves tend to be the weakest wave, and this move has certainly had that characteristic.  It's not been particularly explosive and hasn't generated any bell ringing A/D or Up/Down Volume statistics.  It's also been quite choppy, and therein lies a problem for EW analysis.  As a wave in a diagonal it should have a three wave a-b-c count, but the pattern so far makes it difficult to determine with any confidence whether prices are still in wave "a" or have completed an "a" - "b" sequence and are in wave "c".  With this in mind there are two possible alternates.

Alternate #1

Alternate #2


Alternate #1 shows "a" & "b" done with "c" in progress, Alternate #2 shows "a" still in progress.  The difference is significant in both time and price.  In Alt #1 the top is only 30 - 40 points away and thus should be seen in the next month or so, in Alt #2 the top is in the vicinity of the 2007 highs in the 1580 area and thus should take several months to be achieved.  This a very important long term top because it could very likely mark the conclusion of the entire bull market run from Mar '09 (there is the possibility of a 3rd zig zag from the Mar '09 lows, but that doesn't seem likely).  Unfortunately the only way to finally decide which of the two alternates is correct is to watch the pattern as it unfolds.  Particular attention needs to be paid to the form the corrections take - the EW rule of alternation should help to determine the accurate EW count. 


Sunday, September 16, 2012

Correction to 9/15/12 update

The update posted yesterday contained reference to the Vindicator Buy/Sell and an apparent flat line in that index.  The more I thought about that the more I questioned the reading.  Today I investigated the components of the Buy/Sell index and discovered that last Tuesday (9/11 !!) either TOS or the NYSE altered the format in which trading volumes are reported.  They moved the decimal point to the left one position in the data so that the reported volumes appear to be 1/10th of what they appeared before the change.  Totally screws up the chart - very frustrating.  Below is the recent chart:


Here's the chart zoomed in to the four days from Tuesday through Friday:


As can be seen the Buy line is in fact not flat lining but rather exhibiting a pattern which would be expected - i.e. ramping up in conjunction with the rally.  So the comments about distribution and flat lining made in yesterday's post were based on faulty data and are completely in error.  My apologies.

Saturday, September 15, 2012

Saturday, 9/15/12 update

A lot of ink has been spilled since Thursday's QE3 announcement.  Some very valid criticisms have been aired of the Fed's move - the long term effects can only be regarded as potentially disastrous.  But to look at this action with a long term perspective is to miss the point - it's a pretty fair bet that the goal has a time horizon of less than 60 days - specifically Tuesday, Nov 6: Election Day.  That may be cynical, but it sure has that smell.  So it could be that given an appropriate delay, say until January or February, QE3 may get walked back.

The rally on Thursday into Friday itself has generated an ominous pattern on one of this site's proprietary indicators.  The Vindicator Buy/Sell index attempts to measure buying vs. selling pressure in equities.  It is based on Adv/Dec and Up/Down Volume statistics.  The index showed buying and selling to be almost equally balanced on Thursday and Friday.  Normally a rally of that sort will see the Buy line (green line in the chart) ramp up while the Sell line (red line) flat lines.  Instead both flat lined.  What this is saying is that there was a significant amount of distribution occurring during the ramp up.  The market certainly generated high overbought readings on standard momentum indicators over the two days, so a pull back is in order here.  The question is whether the picture shown by the Vindicator Buy/Sell is signalling that more than a normal correction to an ongoing rally is in the offing.  

SPX  /  Vindicator Buy-Sell (30 min bars)

Click here for current charts of the ES including daily and hourly Elliott wave counts.

Saturday, September 8, 2012

Saturday, 9/8/12 update

The ES finally broke out of it's slumber this week with a rally off a triangle type correction.


Triangles always precede the last wave in a sequence - in an impulse it's thus always a 4th wave with the 5th and last wave to follow.  In this case the ES/SPX is in the 5th wave of a move that dates back to the Jun 25 lows.  In equities, 5th waves tend to be weaker than 3rd waves. Underlying A/D and Up/Down statistics for this rally are somewhat tepid and so are following form.

From a more long term perspective the ES/SPX is in an ending diagonal that commenced at the ES 1068 low of last October.  That move is in it's late stages. It's last leg, Intermediate W5, has been in progress since the ES 1262.00 low of Jun 4.   As a wave in a diagonal Inter W5 should have 3 legs (an a-b-c).   The key question right now is whether Minor Wave "a" of that move is still in progress or whether it was complete at ES 1357.00 in Jun 19.  If Minor "a" is still in progress than Inter W5 will take more time to complete than if Minor "a" and "b" are done and Minor "c" is under way.  The charts below outline these alternates.

Minor Wave "a" complete, Minor "c" in progress

Minor Wave "a" still in progress

Wednesday, September 5, 2012

Wednesday, 9/5/12 update

The Chinese water torture continues.  It's been said that markets actually spend 80% of there time drifting sideways and only 20% trending, sure has been that way of recent.

The ES is building some type of wedge structure, on Monday it looked to be a 4th wave which possibly only needed one more stab down to be completed.  On Tuesday Voila!! the ES stabbed down and possibly put in the last move of the correction:


To be correct this count requires the ES to rally up and away from Tuesday's low in a 5th wave impulse, which it still may do.  However, the pattern since Tuesday's low has been a continuation of the meandering seen recently with lot's of short term 3 wave moves.  So it's possible that the 4th wave is not yet complete.  It could be that the wedge is actually wave "b" of a zig-zag with wave "c" just starting:


Either way the ES should be breaking out of it's sleep walk very soon.  Which will be a relief.

Monday, September 3, 2012

Monday, 9/3/12 update

The ES looks to be completing a 4th wave triangle that's been in progress since the 1424.75 high two weeks ago.  Wave "e" of that structure was either done at last night's low of 1396.75 or will be done in the next day or so.  A 5th wave rally should ensue.
    

On Friday Al's Indicator bounced off a low of .93 that was generated on Thursday (this indicator is based on daily statistics).  Readings below 1.00 on this indicator are relatively reliable bottoming signals, so this would lend support to the thought that the ES is wrapping up a correction.


The last month or so has been a Chinese water torture, hopefully all the fund managers that have been vacationing in the Hamptons etc. are back on the job tomorrow and we'll see some movement.