To the markets. There are two main possibilities that I see at this point which were discussed in daily posts this week - designated Doors #1 and #2.
Door #1 is the preferred count and assumes a major long term low on Jul 5 at ES 1002.75 with the action since then a series of waves 1 and 2's. The action since Jul 20, especially the action this week since the Tuesday morning highs, has been a little difficult to read from an Elliott standpoint. On review, a 5 wave count can be seen in the rally sequence from 7/20 through 7/27, and although it is a little bit awkward it fits all Elliott rules. The selling from Tuesday morning into yesterday's (Friday) lows is choppy and overlapping and thus very much corrective in nature, although it is possible to make a 5 wave count out of it as will be seen later. More likely is a double zig zag as can be seen on the Door #1 hourly chart below.
DOOR #1 - Daily ES

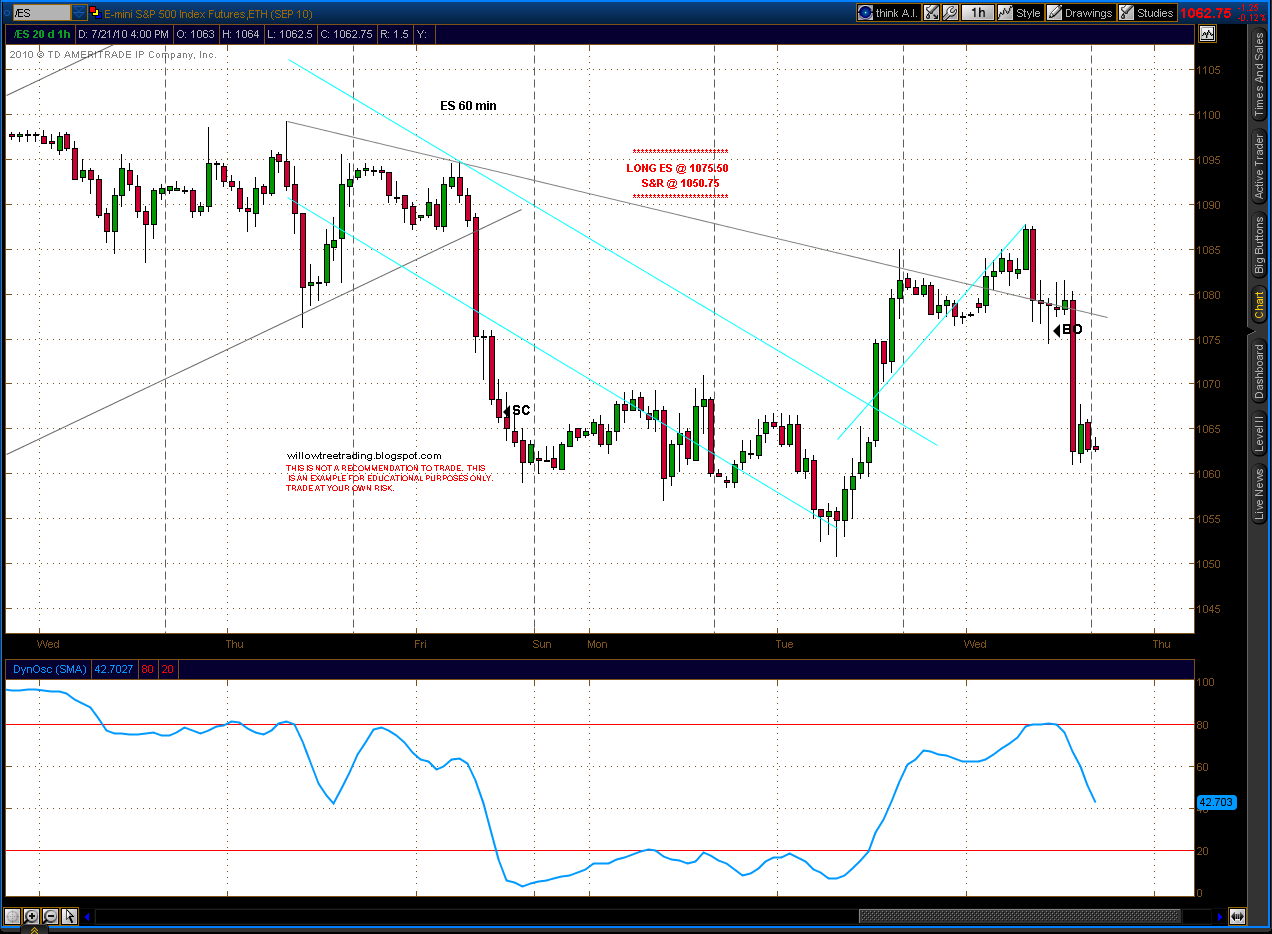
DOOR #1 - Hourly ES

Door #2 assumes one more major selling trend is necessary to complete an intermediate term correction that started in late April. This count has a B leg of a final A-B-C sequence ending at Tuesdays highs with the final C leg in progress. The problem with this is the pattern since those highs. That pattern can be labeled with a 5 wave count, but it's awkward to say the least. As mentioned earlier, it's quite choppy with a lot of overlaps and is much more corrective in nature. This count would be invalidated if the ES trades above 1129.50 in the near future. That level marks the high of Wave B (blue).
DOOR #2 - Daily ES

DOOR #2 - Hourly ES

One other possibility worth noting comes from Daneric (http://danericselliottwaves.blogspot.com/).
This is the ultra-bear P3 scenario. It see's a Major Wave 1 complete at the low's of May 25 with an irregular flat correction in progress since then. Currently the market is tracing out a diagonal 5 wave C leg with the 4th wave done or close to done and a 5th wave yet to go. That 5th wave would terminate at or just above the high of Jun 21 at ES 1129.50. After that of course would come a powerful 3rd wave market collapse.
P3 BEAR MARKET SCENARIO - Daily ES


The Vindicator Buy/Sell line is supporting the near term bull case. The Buy line crossed below the Sell line briefly on Thursday but had crossed back above it by the end of the day. It continued to work it's way higher through the day Friday. The message it's giving us is that through the selling from Tuesday into Friday morning buying pressure has exceeded selling pressure under the surface (except for a brief period on Thursday). This is one of the reasons Door #1 has remained my preferred count.