CURRENT CHARTS


Click HERE to view current charts


Monday, January 31, 2011

Monday 1/31/11 wrap up

For the last 3 weeks the AUD has been very difficult (to put it politely).
The following hourly chart was presented on the weekend update as the most likely count for the AUD:


Nice and clean, fits the Elliott rules, etc.  Well, today the AUD rallied to a high print greater than that of Friday and threw that count into disarray.  The thought of a Minor Wave b (red) triangle is still in play, but it's hanging by a thread.  If the AUD continues today's rally up and past the high of Minute Wave "c" then this count is totally ruled out.  Minute Wave "c" topped at .9963.  Updated Minor W b triangle count looks like this:


There is an alternate count that has increased in probability with today's action.  It counts the entirety of the pattern from the late Dec high as a triangle correction.  Also, that correction can be counted as complete as of the low print on Sunday evening.

AUD hourly - alternate


AUD daily - alternate


As can be seen on the daily chart, the alternate has Intermediate W 4 (purple) done as of the Sunday evening low with Inter W 5 now in progress.  This would be the last wave up to the bull market that started at the lows of last May.  If the alternate is correct, some estimates can be made for Inter W 5.  Inter W 1 only lasted 4 days and traveled .0488, so the point where Inter W 5 = Inter W 1 is 1.0300 (exactly), and if the duration is the same that price should be reached by the end of the week.  

Sunday, January 30, 2011

Weekend Update 1/30/11

Friday was almost certainly a major trend change day across many markets.  Don't have a lot of time for discussion/explanation so I'm going to throw up a bunch of charts, hopefully you're familiar enough with Elliott Wave to interpret them.

ES  

ES - 4 hour bars
There is an alternate on the ES, and that would be that Friday's action was the "C" wave of a Minor W4 flat.  In this case we have Minor W5 yet to occur.  Given the apparent trend change action in other markets I rate this alternate as low probability.

ES - daily 

EUR  

EUR hourly   

EUR daily 


AUD   

Aud hourly 

Aud daily  

Gold 

Gold hourly 

Note how Minute Wave C (green) is almost exactly equal to Minute Wave A.

Gold daily 

Gold is the muddiest picture of the 5 markets presented.  If the count on the daily chart is correct, then gold is in a Minor W4 (red).  Minor W2 occurred in Dec '09 to early Feb '10 and was a simple zig zag.  Thus Minor W4 needs to be a flat or triangle or some type of complex formation by virtue of the Elliott rule of alternation.  Also, it would be expected to be of similar duration as Minor W2 which lasted about two months.  So far Minor W4 has traced out a simple zig-zag down over the space of a little less than a month.  So it may not be done yet.  The complicating factor is that the Minute W5 (green) labeled at the high of early Jan can be backed up to the high of early Dec with some re-labeling of the true end of Minute W4 (it would be an irregular flat ending at the Nov 17 low).  In that case we can count a more complex double zig-zag as ending at last week's low.  In that case we've satisfied the Elliott rules for the Minor W4 correction.

Wednesday, January 26, 2011

Wednesday 1/26/11 wrap up

ES made another new high today.  I've had to re-do the count presented in the weekend post.  As mentioned in that post, a lot of press was given to the high of a week ago being THE high for a while, any time that happens you can almost bet that the news is wrong.  And here we are.


This count still shows the ES to be in the 5th wave of the move up off the late Nov low (and from the Jul low as well).  However, with the resiliency that's been displayed in equities this interpretation has to be rated as possible - not probable.  Meanwhile, if you're long, enjoy the ride.


Gold and Silver generated a buy signal on the hourly Trend/Osc last night (1 AM for Gold, 2 AM on Silver) so I went long both metals between 8 and 8:30 this AM.  It was a nail biter through the middle of the day, but after lunchtime both trades really started cooking.  Hard on my nerves but in the end feels good in the pocketbook.  FYI - I do post my trades to this site (just below the header above) as soon as I execute them.

Gold hourly Trend/Osc 

Silver hourly Trend/Osc  

Monday, January 24, 2011

Monday 1/24/11 wrap up

The AUD appears to be in the 4th wave of a bull market dating back to last May.  It's either an Intermediate W4 (as shown in the daily chart below) or a Minor W4 (alternate count - not shown).


Within the current wave there is a distinct possibility that a triangle is being formed.  This possibility will be ruled out very quickly in the next day if the AUD extends it's current up swing significantly past the upper boundary of the possible triangle.  That boundary currently is in the .9960 to .9970 area.


On the ES, still holding the shorts from last week.  Little bit dicey today, ES was within sniffing distance of the stop loss.  News stories after the close heralded the new high in the DJIA, but this market really is thinning out - no new high in the SPX, RUT or Wilshire which is classic topping behavior for equities.  So I may get stopped out of my ES position but I do believe I'll be back in on the short side in the very near future if that happens.

Saturday, January 22, 2011

Weekend Update 1/22/11

ES
It appears that an intermediate term top was made at last Wednesday's highs.  The problem is that there are various news stories out there heralding that top, which could well mitigate against it being the actual top.  When too many people agree on a market's course it tends to not be true.  Remember all the press about a head and shoulders formation about a year or so ago?  If I recall correctly, that's exactly what didn't happen.

If it is true, the wave count into the top is as follows:
5 Minute waves up complete from the low of  Jan 10
5 Minor waves (red) up complete from the low of Nov 29
5 Intermediate waves (purple) up complete from the low of Jul 7
-- which completes a Major Wave 1 or A of over 6 months duration.  This should put us into a major down move with a target of the prior 4th wave lows.  Looking at the daily chart there was a lot of time spent in the ES 1162.50 to 1200 area in October and November.  That area also marked the 4th wave low in Minor W3 (red)  and the low of Intermediate W4 (purple).  So that area is a reasonable target for this sell-off.

ES - 2 hour bars
 
ES daily

Helping to confirm that the top was in on Wednesday is the clear 5 wave structure of the move down into Thursday's low.  That's been labeled as a Minute W1 (green) for now.  Also, the move back up from the Thursday low is a very obvious 3 wave zig zag (so far), that's been labeled Minute W2.  Almost too easy.  In addition to the question of whether Wednesday did in fact mark an intermediate term top, there is the possibility that the rally off Thursday's low is not yet finished.
I'm currently short ES with about a 1/3 position that I put on Thursday afternoon.  I only went 1/3 because the Trend/Osc system has not yet confirmed the downtrend on an hourly basis nor on the daily.  If and when the Trend/Osc generates a sell signal I'll expand to a full position.

ES - 1 hour bars

EUR/US$
As outlined in prior posts, the EUR appears to be tracing out an irregular flat that started at the low of Nov 30.  The Minor W a  and Minor W b  legs of that formation are concluded and the Minor W c leg is in progress.  The high on Friday was 1.3622 which is exactly a 50% retracement of the November sell off.

EUR daily

However, the internal count of Minor W c does not yet appear complete although it does look to be in Micro W 3 (black) of Minute W 5 (green) suggesting that a top is nearby.  The next fib retracement level of the November sell off is the .618 level at 1.3776.  The EUR could well hit it.

EUR hourly

I'm currently long the EUR from Tues Jan 11 at 1.2989.  Handy profit of around $7,800 per contract at Friday's close.  Nice.

Gold
Gold has been a muddy mess for some months now.  I'm not going to spend a lot of time trying to dissect it, just going to throw up a couple of ideas as to the current wave count. FYI there are another couple of alternates besides the two below, this is one of those situations where the count will become clear only when it's receding in the rear view mirror.  My sense is that there's some more downside left in the selling that started at the beginning of Jan, but it's not a high confidence call.  Made a little money shorting gold this last week.  Both the hourly and daily Trend/Osc for gold are in "DOWN" mode.  However, there was a buy signal on the hourly Trend/Osc for Silver on Friday, and since the two tend to move together and the most recent gold sell off appears to have 5 waves down complete or close to complete, I went flat with respect to gold.  If gold does move up some early next week in a non impulsive fashion I will consider going back in with a short position.  BTW, the same thought applies to Silver.

Gold daily (long term perspective)

 Gold daily

Gold daily (alternate count)

Wednesday, January 19, 2011

Wednesday 1/19/11 update

4:00 PM CST
EUR
Looks like EUR is in Minute W5 (green) of Minor Wave c (red) of an irregular flat correction that started at the Nov 30 low.  Target high for Minor W "c" was the .382 to .50 retracement of the November sell off.  Also, that high needed to equal or exceed the Minor W "a" high at 1.3493.  Today's high print of 1.3534 exceeds the 1.3493 Min W "a" high and is almost exactly halfway between the .382 and .50 retrace levels.  Thus Minute W 5 and thus Minor W "c" is possibly complete at today's high, but the pattern looks like it needs a little more upside.   

EUR Daily

EUR Hourly

AUD 
From an intermediate term perspective the AUD is well into a corrective sequence.  The question is whether this is an Intermediate or Major Wave correction.  For the near term this question is irrelevant, as there has only been one corrective wave down so far.  That wave down is being labeled as Minor Wave "a" for now.  Minor W "a" started at the Dec 31 high of 1.0168 and ended at a low of .9736 on Jan 11.  Since that low there is a clearly identifiable three wave counter trend rally with a high print today at 1.0009.  The .618 retrace of Minor W "a" is 1.0003, pretty darn close.  There might be one or two more upside runs in the AUD yet, but if that's the case it shouldn't travel too much farther up from here.


10:15 AM CST
Is the top finally in for ES?  Could be.  I had a target of ES 1297 +/-, high this morning was 1296.25.

2 hour bars

Daily bars

Thursday, January 13, 2011

Thursday 1/13/11 update

3:30 PM CST 
In the ES, Minor W4 (red) of Intermediate W5 (purple) appears to have concluded on Monday.  Thus Minor W5 is in progress.


In the Minor W5 rally from Monday's low it looks like Minute W1 & W2 (green) are done with Minute W3 quite possibly concluded as well.  So we might be on the home stretch - might be - finally!!


There are a a couple of fibonnaci targets that may prove to mark the final conclusion of Inter W5.  Inter W1 traveled 125 points and Minor W1 of Inter W5 went 62.75 points.  Starting from the Inter W4 low at 1172.25,  Inter W5 = Inter W1 at ES 1297.25.  Starting from the Minor W4 low of 1258.00, Minor W5 = .618 x Minor W1 at ES 1296.75.  So the ES 1297 area could prove to be the upside limit.


10:00 AM CST
Euro looks like it's in Minor Wave C (red) of an irregular flat which started at the lows of Nov 30.


Targets are the area of the Minor Wave A high of 1.3493 from Dec 14, which is right in the area of a .382 retrace of the November sell off, and next would be the .50 retrace at 1.3622.

Monday, January 10, 2011

Monday 1/10/11 wrap up

When they were little my kids used to love watching a movie called "Never Ending Story".  I think that show is playing right now in the ES.

Most likely Elliott count in the ES is that a Minor Wave 4 (red) triangle is in progress, with the first three legs complete and the "d" leg currently being traced.  Minute "d" (green) should top in the ES 1275 - 1277 area and be followed by a final stab down for Minute "e".  After that we should finally be into Minor W5.

The best alternative count here is that the rally last Wed and Thur was itself the extent of Minor W5 (it's labeled Minute W "b" in the above chart).  This is definitely possible.  However, that rally was more a 3 wave move than a 5, and the downside action that ensued was choppy and overlapping, so this alternate has a low probability.

A final alternate is that Minor W4 was done at last Wednesday's low and the ES is tracing out an ending diagonal Minor W5 with the first two legs complete and the 3rd in progress.  Under this alternate Minor W5 doesn't have much longer to go in terms of either time or distance.

Friday, January 7, 2011

Friday 1/7/11 update

Currencies

AUD/US$
Two main intermediate term possibilities on AUD at this point.

Alternate #1 (daily chart)

Alternate 1 has an Intermediate W3 complete as of the Dec 31 high.  Inter W4 is in progress and Inter W5 yet to occur to complete the rally off the May '10 lows.  Target for Inter W4 is the area of the preceding Minor W4 low around .9500.

Alternate #2 (daily chart)

 Alternate #2 has all 5 waves of the rally off the May '10 lows complete at the Dec 31 high.  The main difference in this alternate is the depth of the expected correction.  If this alternate is correct, the AUD should eventually retrace to near one of the main fib points of .382, .50 or .618.  This gives a target area anywhere from .9359 to .8858.  Quite a wide range, so in this case the best bet is to monitor the EW count as it unfolds to zero in on a more precise target.  This alternate increases in probability if and when the sell off pushes significantly below the .95 area identified in Alternate #1.

EUR/US$

The EUR has just been a mess to figure out (and trade) since the lows of Nov 30.  There are lots of alternative counts for the pattern since then, here are two.

Alternate #1
Hourly Chart
Daily Chart

In this alternate we concluded an Intermediate Wave B at Tuesday's high and are now in Intermediate Wave C of a 3 wave move down from the early Nov highs.  Intermediate Wave C should achieve the lows of last June at the very least, which gives an initial target in the 1.18 area.

Alternate #2 (Daily Chart only)

Alternate #2 is the same as #1 in the sense that we are in a 3 wave move down from the Nov highs and are eventually headed to the 1.18 area or more.  However, in this scenario we are tracing out an irregular flat Intermediate Wave B and are only in Minor Wave B of that move.  We thus are yet to see a sharp Minor Wave C rally before concluding Inter Wave B, at which point we should turn sharply lower.  This alternate will be ruled out if we don't begin a sustained up move in the very near (next day or two) future.

Wednesday, January 5, 2011

Wednesday 1/5/11 wrap up

ES
- keeps on a chuggin'.  Revised EW count for about the tenth time:

We are in Intermediate W5 (purple) from a low on Nov 29.  Minor W1 (red) in this count was formerly labeled Minor W1 thru W4, mainly because the strong rally action of Dec 1 & 2 was more typical of a 3rd wave than a 1st wave.  But the continued march to the upside has forced a rethink.
I've labeled Inter W5 as complete at today's high, but that is a longshot.  More likely Minor W5 has longer to run.  Likely targets are ES 1280, at which point Minor W2 through W5 will have traveled the same distance as Minor W1 (62.75 points), and ES 1297.25 at which point Intermediate W5 = Intermediate W1.

Saturday, January 1, 2011

Weekend Update 1/1/11 HAPPY NEW YEAR!!!

Really got a kick out of writing the date in the header - "1111" - it's a binary code New Year!!

December has been a very difficult month for analyzing the markets I follow.  However, the picture has crystallized in the last few days, and it appears we are closing in on an important juncture across the board.

ES
The downstroke from Wednesday PM's high into Friday mornings lows looks very much like a descending triangle (wedge).  This fits the Elliott rule of alternation for Minute W4 (green) since Minute W2 was a zig-zag.  If Minute W5 is in progress it is the last leg of Minor W5 (red) that commenced in early Dec, which in turn is the last leg of Intermediate W5 (purple) that started at the Nov 29 low. Intermediate W5 concludes the rally that started on Jul 6.  So, if we mark this morning's low as the start of Minute W5 we are on the home stretch of the rally that started last summer and has resulted in a 250 point gain in the ES.

ES hourly

ES daily

Needless to say, if this analysis is correct we could see a significant correction in January.

CURRENCIES

The best way to make sense out of the EUR/US$ is to take a look at the DX.  It appears that a spike low in late Oct marked the start of a 5 wave Intermediate term rally which ended with a 5th wave failure at the high of Dec 23rd.   Since then the DX has sold off sharply and may have hit at least an interim bottom Friday in the 79.00 area.  That level provided support twice in the month of Dec.


The low Friday could mark the end of the correction to this rally which started in late Oct.  However, I suspect it doesn't as it's only ran for 5 days, which doesn't seem like enough time to correct a multi-month rally.

The 5th wave failure in this count, if correct, helps validate a count I've had for the EUR.  I also had considered a 5th wave failure (to the downside) in the EUR.  That idea appeared pretty awkward and unlikely so I rejected it, but the action this week plus the count on the DX has increased it's probability.


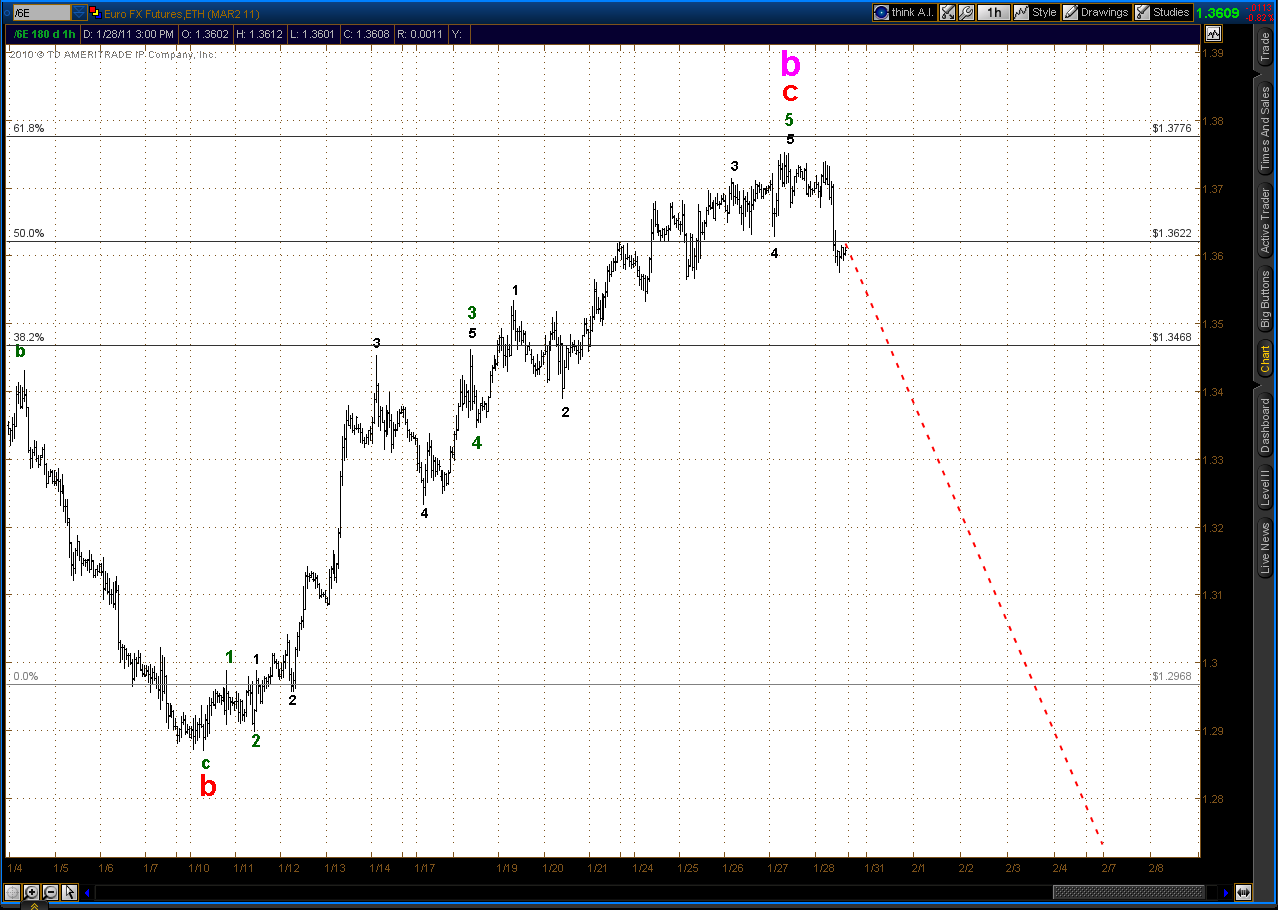
This count has 5 waves down from the high of Nov 4.  The 5th wave travels from the peak of the rally that ended Dec 14 to the low of last Thur Dec 23, and is a failure as discussed.  Since then we've had an "a" leg rally from Dec 23 to the high on Dec 28, a "b" leg sell off on Dec 28, and are currently in the "c" leg.  Targets for c are the Minor W4 (red) peak @ 1.3493.  This is only a little past 1.3468 which is the .382 retrace level of Minor W1 through W3.  Past that point the next likely area is the .50 retrace @ 1.3622.
The primary alternate count on the EUR is that the sell off in November was an A-B-C and that the pattern since the Nov 30 low is also an A-B-C counter trend move.  In this scenario we are currently in the C leg of the counter trend.  There isn't any practical difference between this alternate and the above count.  Targets for this alternate are the same.  The only advantage is aesthetic - it avoids the awkward looking 5th wave failure presented above.


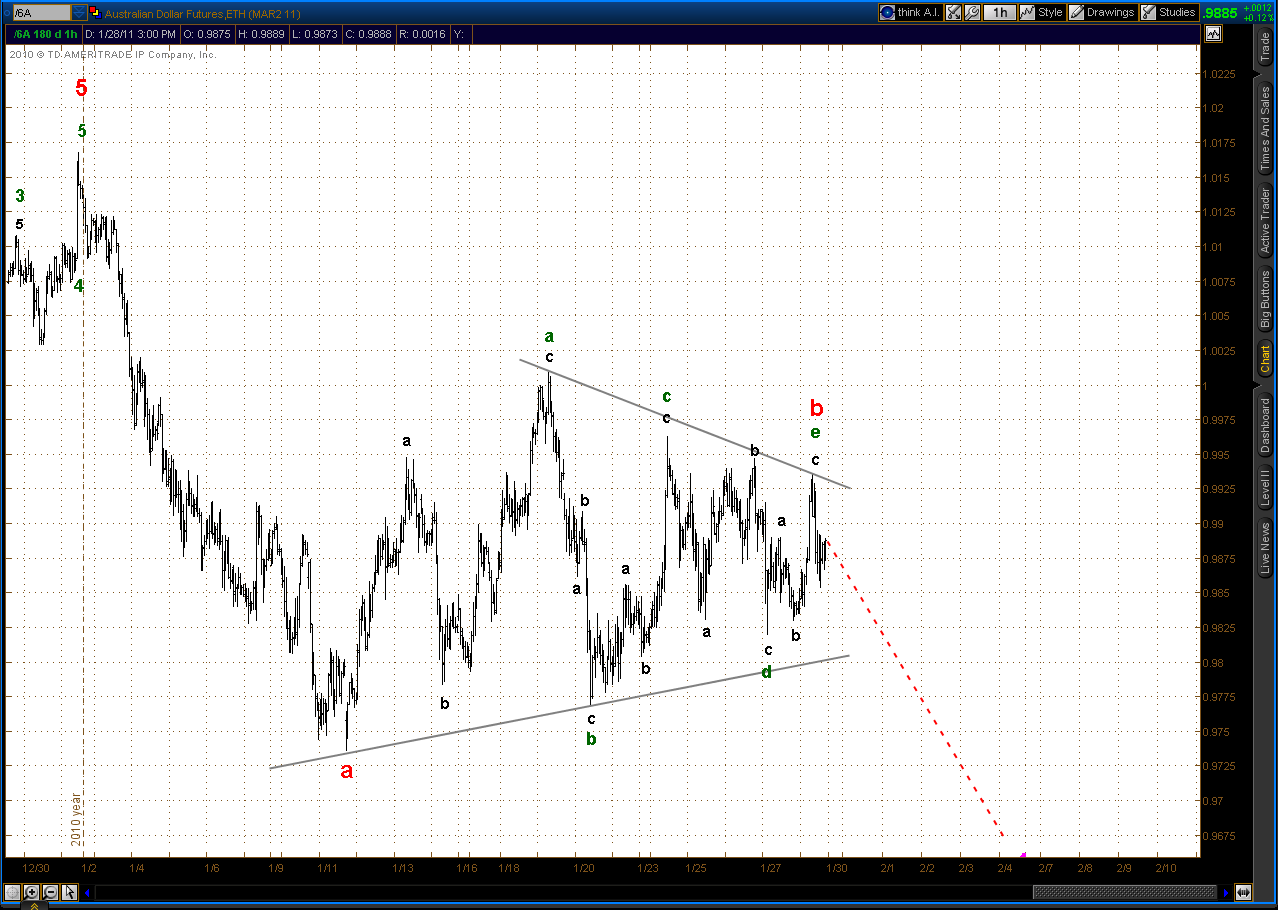
The AUD/US$ has been stronger than the EUR.  It appears to have completed a Minor W4 (red) triangle type correction Dec 16 and has been on a tear since then.


Since the Dec 16 low there has only been one significant pullback which was actually the very next day.  I've labeled them as Minute W1 and W2 (green) for now, but this move needs to develop more to be confident of that labeling.  Right now it's pretty much an upward blur.
This is, however, a 5th wave, so it is the last leg before a correction of one higher degree.  Some longer term perspective:


The AUD has been in bull mode since a low print @ .8049 on May 25.  Since that low there's been an Intermediate W1-W2 (purple) with Inter W3 in progress.  Within Inter W3 we've had Minor W1 through W4 (red), with Minor W4 the triangle formation that concluded on Dec 16.  Minor W1 traveled .0689, Minor W3 was .1890 and the maximum width of Minor W4 was .0616.  The "e" wave of Minor W4 ended at .9725.  We can set some likely targets for Minor W5 from these values.   From the "e" wave low of Minor W4: 
        Minor W5 = Minor W1 @ 1.0414
        Minor W5 = .382 x Minor W3 @ 1.0446
        Minor W5 = Max width Minor W4 @ 1.0341
So an initial target area for Minor W5 is 1.0341 - 1.0446.

GOLD
Gold has been on a seesaw since mid-October.  It's been difficult to ascertain just what it's been doing from an EW perspective until recently.  
The most likely count is that of an ending diagonal since the late Oct. low.

Gold daily

Gold hourly

Like the ES, EUR and AUD this market appears to be in a 5th wave, the difference being that Gold's pattern has been much more sideways since it's Oct low.  If the count is correct, Gold is in the "c" leg of the 5th wave of an ending diagonal Minute W5 (green).  Target is the upper trendline in gray on the charts which connects Micro W1 and W3 (black).  That trendline is currently in the 1440 area.  In turn the Minute W5 is the last leg of Minor W3 which dates back to a low in early Feb.  It is thus nearing a top of some significance.  When that top is made, downside target would be in the area of the Minute W4 low around 1320.

There is an alternate count here, and that would be that the seesaw pattern since the Oct high into the mid-December low is actually a Minute W4 triangle.  This would mean that Minute W5 only started at the Dec 16 low.  This count would allow for more distance and time for Minute W5.  How much? Well, Minute W1 traveled 222 points and lasted almost 4 months, and Minute W3 was 232 points and lasted almost 3 months.  Since Minute W4 is a triangle in this count, and triangles generally precede a 5th wave that is more of a final burst to the upside and is generally the length of the widest point of the triangle, then it's reasonable to expect a duration of less than Minute W3 and a distance of travel of around 110 points.  The end of Minute W4 in this count was the low of 1361.60 on Dec 16, so 110 points gives us a target around 1470.

Gold daily - alternate count  

This Gold alternate count has an awkward look to it for a triangle.  This is why it is not my primary count.  However, if Gold rallies significantly past the upper trendline drawn in the primary count then the alternate becomes more probable.

SILVER  
I was going to do an in depth on Silver but it's late Saturday PM and the clock is running out.  A short version is that SI completed a lengthy 4th wave triangle formation on Sunday evening Dec 26, and is currently in a 5th wave.  So a top is near in SI as well.


Wrap-up
ES, AUD, Gold and Silver all appear to be in intermediate term 5th waves, and the EUR appears to be in the last phases of a counter-trend rally.  January could be a doozy of a month for those with a bearish inclination.