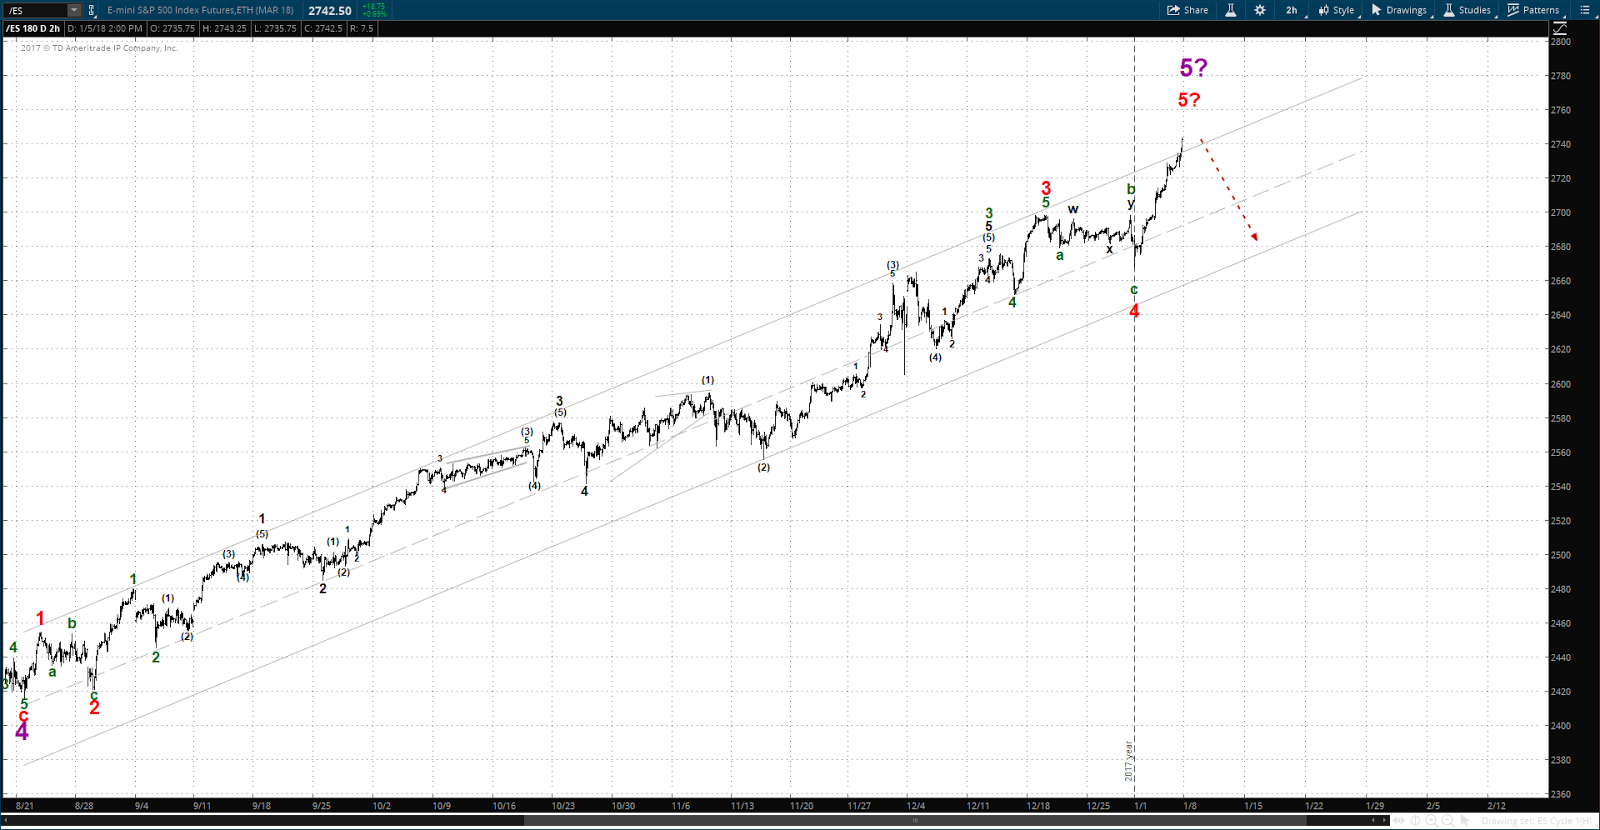
The pattern in the ES over the holiday weeks can be counted in two different ways. 1st possibility is that of a 4th wave triangle leading into a quick thrust of a 5th wave on Friday followed by the 1st leg of a correction:
This would portend more corrective activity over the coming days.
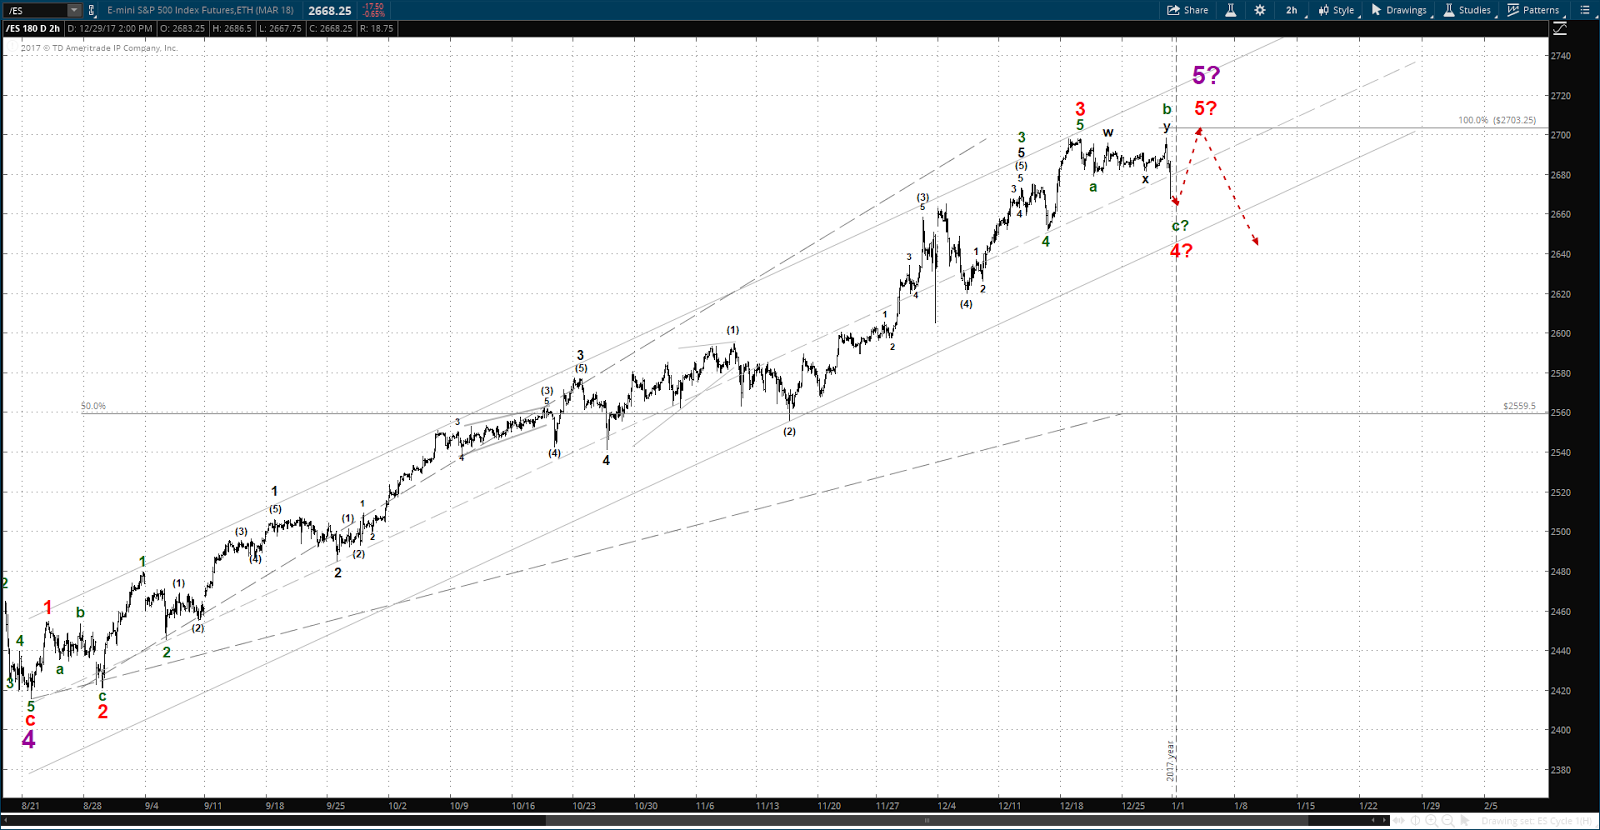
The 2nd possibility is that of a flat style correction with Friday's selling being the "c" - and thus last - wave of that pattern:
This would mean a quick conclusion to the selling (if it's not already done) and another ramp up almost immediately. This alternate is the higher probability IMO.
From a longer term perspective the preferred count is showing a major top in the near future:
This count has the ES in Intermediate W5 (purple) of Major W5 (blue) of Primary W III, with Primary W III being a bull market that commenced in 2010 and Major W5 being the bull market of the last 2 years - if true, a significant juncture.
However, the parabolic rise of recent months is more typical of a 3rd wave rather than a 5th wave as labeled above. So the thought is that the pattern from early 2016 thru mid 2017 is a series of nested 1st & 2nd waves with the run up from August thru now being the 3rd of a 3rd of a 3rd of a 3rd wave - i.e. the point of maximum acceleration:
This count has to be given serious consideration - if for no other reason than that there have been no serious signs of topping action as of yet.
NOTE: dotted lines show potential EW structures and are not necessarily accurate price/time forecasts