This is beginning to look suspiciously like we're putting in a bottom. We've bounced off ES 1037 three times in the last 5 days, obviously that level needs to be penetrated. My guess is that if we break below that we'll break down hard. Meanwhile that level has turned into significant support.
Current preferred (bearish) Elliott count:

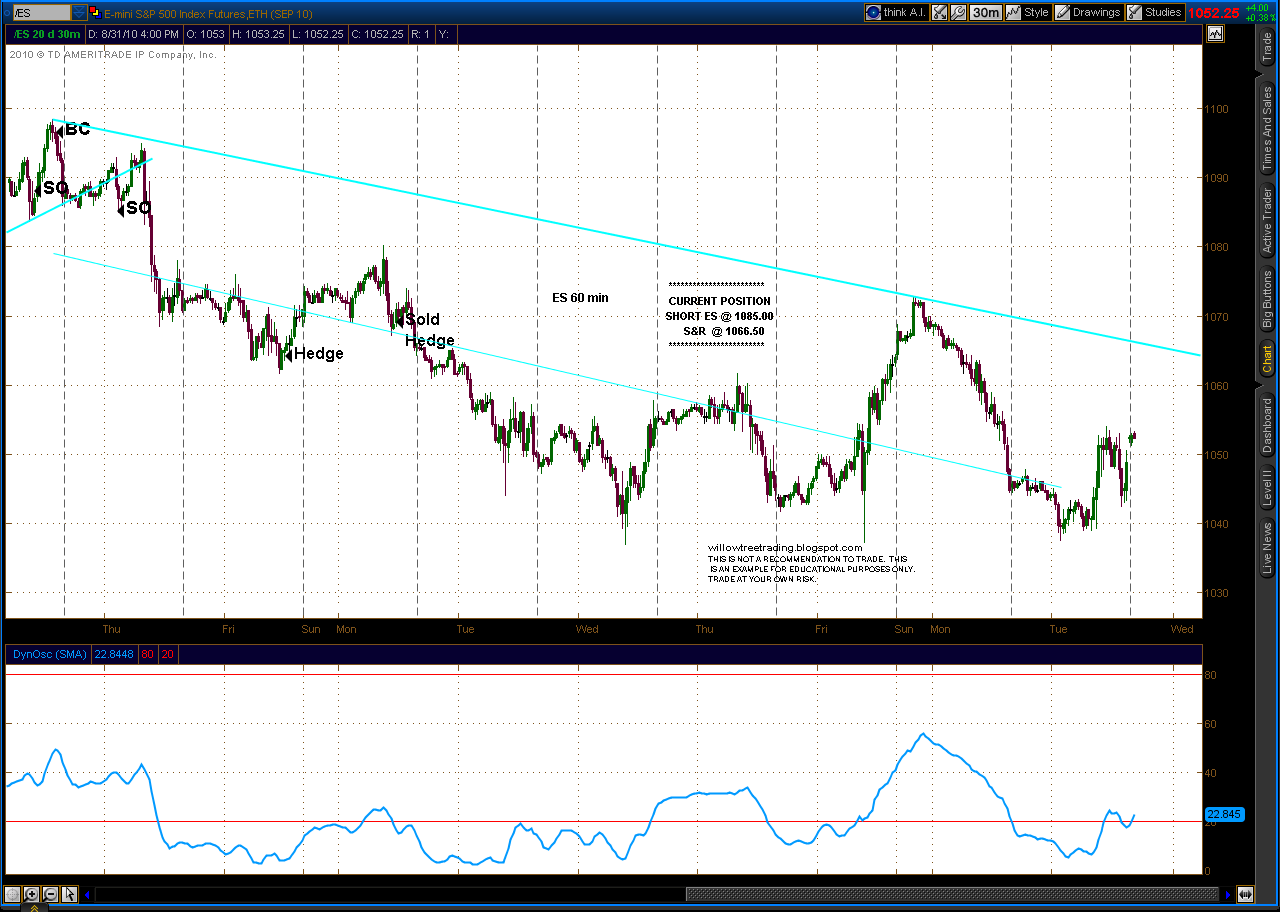
The Trendline and the Dynamic Oscillator in the Trend/Osc system re-set when we touched last night's low of ES 1037.50, however the Dyn Osc once again poked above the 20 line today. (Note: TOS for some reason drops much of the data from the last couple days if set to an hourly bar, but I discovered after the close that it works just fine with a 30 minute bar, so that's the chart format below). The Stop & Reverse has been moved lower to 1066.50 which is just above the down trend line, otherwise still holding short ES from 1085.00.