ES
ES - 4 hour bars

ES - daily

EUR
EUR hourly
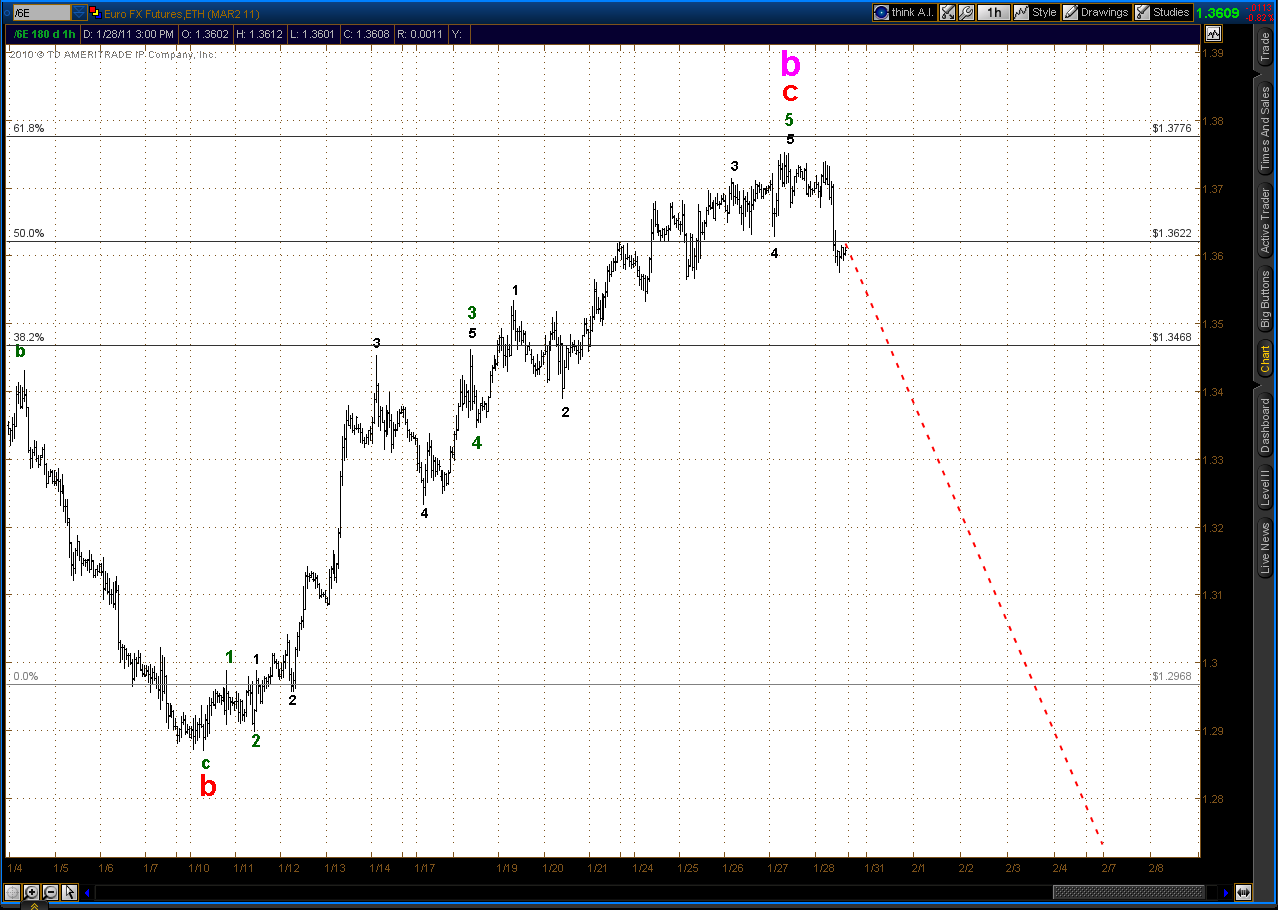
EUR daily

AUD
Aud hourly
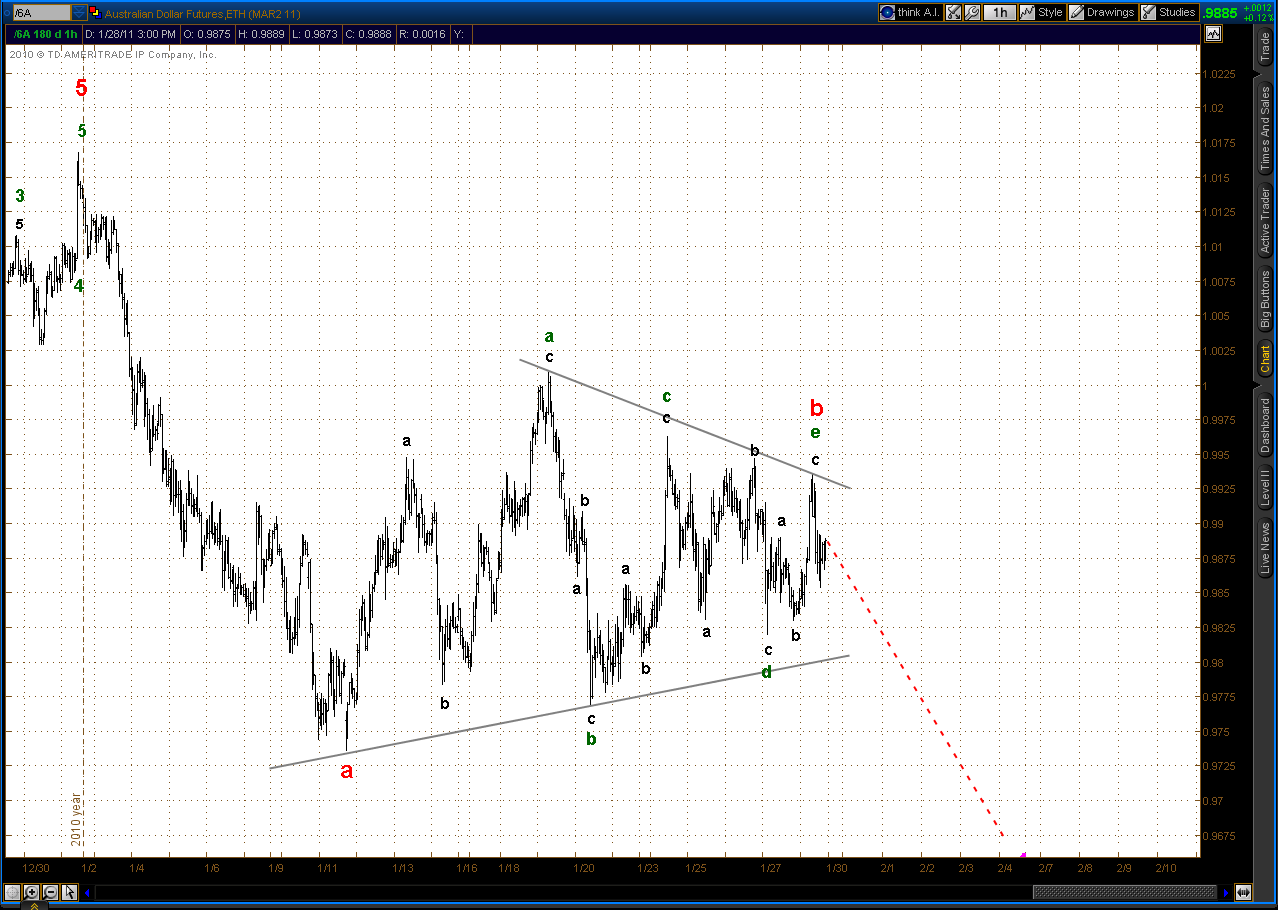
Aud daily

Gold
Gold hourly

Note how Minute Wave C (green) is almost exactly equal to Minute Wave A.
Gold daily

Gold is the muddiest picture of the 5 markets presented. If the count on the daily chart is correct, then gold is in a Minor W4 (red). Minor W2 occurred in Dec '09 to early Feb '10 and was a simple zig zag. Thus Minor W4 needs to be a flat or triangle or some type of complex formation by virtue of the Elliott rule of alternation. Also, it would be expected to be of similar duration as Minor W2 which lasted about two months. So far Minor W4 has traced out a simple zig-zag down over the space of a little less than a month. So it may not be done yet. The complicating factor is that the Minute W5 (green) labeled at the high of early Jan can be backed up to the high of early Dec with some re-labeling of the true end of Minute W4 (it would be an irregular flat ending at the Nov 17 low). In that case we can count a more complex double zig-zag as ending at last week's low. In that case we've satisfied the Elliott rules for the Minor W4 correction.
