CURRENT CHARTS


Click HERE to view current charts


Saturday, October 30, 2010

Weekend Update 10/30/10

The ES continued tracing out what looks to be a triangle into the close Friday.  We should see one more dip early next week followed by a final thrust over ES 1200.  These would be the 4th and 5th waves to the rally that started in late August.  I believe a significant factor in the rally of the last couple months is anticipation of Republican victories next Tuesday, so this projection would fit the "buy the rumor sell the fact" scenario.  Only problem is a lot of folks are seeing the same thing, when too many people agree on a market possibility it tends to mitigate against that idea becoming reality.

I believe there are two possibilities into the end of the year.

Alternate 1

Alternate 2

Historically the end of year has an upward bias.  It also tends to have very low volatility, especially between Thanksgiving and Dec 31.  For these reasons Alternate 1 has to be given the edge, but I don't believe it's an overwhelming edge.  In other words, we could see some downside fireworks starting next week.

On the currencies, the EUR and AUD are currently in up mode on the Daily (and Hourly) Trendline/Oscillator System.  The EUR is the weaker of the two.  It broke below the Sep-Oct uptrend line a couple of weeks ago, but the Dynamic Oscillator has remained above 80 so it continues in bull mode.  It needs close monitoring - if there is no follow through on the run up that started last Wednesday then it's likely that the Dynamic Oscillator will finally break below 80 and thus generate a sell signal. 
The AUD is quite strong and has to be considered the lower risk choice for a long position. 


Like the currencies, the Metals are also both in up mode on the Daily and Hourly Trend/Osc System.  Gold flirted with a sell signal last week.  The Dyn Osc had moved below 80 on Fri Oct 22 and prices very nearly closed below the uptrend line on Wednesday, but Thursday saw the start of a nice rally and Gold appears to be out of danger for the time being.  Friday saw Gold close at HOD which is pretty bullish.
Silver saw a similar pattern over the last week but looks to be the stronger of the two.


Thursday, October 28, 2010

Thursday 10/28/10 wrapup

On the ES the moves so far this week count best as 3 wave structures.  That would include the sharp selling of today, three legs show up clearly on a 5 minute chart.  Thus it's quite possible that minor wave 4 was not done as of yesterday's lows and is instead developing into a triangle.  If so the a-b-c legs of that triangle are done with today's intraday low and the d leg is in progress with a final bit of selling due in the e wave.   Chart of that idea looks like this:

THAR'S GOLD IN THEM THAR HILLS

Some long term perspective on gold.  Charts are of the GC gold futures contract.
Gold has been in a powerful bull market dating back to 2001.  From an Elliott standpoint Cycle Waves I through IV are complete, with Wave IV done at the lows of 2008 (@ $681/oz.)  That puts us in Cycle wave V since that time.  Although 5 waves completes a move in Elliott, gold behaves like a commodity where the 5th wave is often the most powerful.  This 5th wave is developing in that manner, with an apparent series of waves 1 and 2's of decreasing degree since Cycle Wave IV.  There is thus plenty of upside potential remaining.  This only makes sense in light of the flood of US dollar liquidity being pumped out by the Federal Reserve.  It's a simple equation : more dollars = less intrinsic dollar value = higher gold prices.

Long Term Gold Elliott Count

As can be seen we are currently in the 3rd (minute) of a 3rd (minor) of a 3rd (intermediate) of a 3rd (major) of a 3rd wave (primary).
Shorter term it looks like we're in micro wave 4 (black) of minute wave 3.  Micro W2 was a flat, so a zig zag or triangle for micro W4 would satisfy the rule of alternation.  So far a zig zag is apparent in the move down from the highs of Oct 14, so W4 is potentially complete.

Thursday 10/28/10 update

8:45 AM CST
Buy signals on hourly ES, EUR and AUD overnight.  Sorry having trouble up loading AUD chart.

Wednesday, October 27, 2010

Wednesday 10/27/10 wrap up

On the ES there's a fair chance that we did see the bottom of minor wave 4 (red) today.  If that's the case, Elliott count looks like this:

Minor wave 1 traveled 69.5 points and minor wave 3 spanned 106.75 points.  The wave 4 low today was 1167.25.   Some Fibonnaci targets for minor wave 5:    69.50 x .618 = 43.00 + 1167.25 = 1210.25
                                                                                  106.75 x .382 = 40.75 + 1167.25 = 1208.00

A longer term alternate count right now is that the ES is tracing out an A-B-C flat type correction that started with the highs in late April.  Wave A ended at the lows in early July and wave B is just wrapping up with wave C right around the corner.  "C" waves in a flat are 3rd waves and exhibit 3rd wave character, so we should see some hard selling that moves very quickly if this alternate is correct. 

Wednesday 10/27/10 update

ES/SPX

On hourly Trend/Osc break below uptrend line dating from Oct 4 accompanied by oscillator below 80, so sell signal:

However, daily Trend/Osc still in up mode even though trading below it's uptrend line, oscillator has not broken below 80:

Eliott count shows possibilty of this being a 4th wave in rally that started in late August with a 5th wave ending rally yet to occur:

And finally Buy (green) line on Vindicator Buy/Sell at trend support level which has led to rallys multiple times since the end of August:

So a long ES trade here with a tight stop might pay off.

Tuesday, October 26, 2010

Tuesday 10/26/10

The ES has sure been difficult to read lately, great market for a swing trader but I don't have the time to be on it continuously, which is what it would take right now.  So I've been staying out. 
I presented this chart over the weekend as a possible Elliott count, it shows micro wave 5 (black) and thus minute wave 3 (green) as complete last Thursday.

Updating that through today looks as follows:

However, there is an alternative (there always is), and that is the possibility that the ES has been tracing out an ending diagonal for minute wave 3 as follows:

From a trading standpoint this probably doesn't make a lot of difference, either way the message is we're very close to the end of the rally that started at the end of August and the action looks to continue to be choppy until that point is reached.

Tuesday 10/26/10 update

 9:30 AM CST
Sell signal on hourly Trend/Osc AUD/US$ a little bit ago to go with sell signal on EUR/US$ from yesterday evening.  Both these currency pairs are in longer term uptrends as evidenced by their daily Trend/Osc charts.  This is especially true of the AUD, the EUR is a bit weaker.  I won't be trading these sell signals as a result and am standing by for an opportunity to go long.
     

Monday, October 25, 2010

Monday 10/25/10 Update

6:00 PM CST
Sell signal on hourly EUR - can you say whipsaw??


Buy signals on hourly GOLD and AUD/US$ overnight

Saturday, October 23, 2010

Weekend Update 10/23/10

SPX/ES LONG TERM PERSPECTIVE
Back in May I posted three alternative long term Elliott counts (on Anna Mall's HOB site).  One was mega-bearish, one bullish and one mega bullish.  Daneric @  http://danericselliottwaves.blogspot.com/    is in the mega-bear camp and does an excellent job of outlining that alternative, and Tony Caldero @ http://caldaroew.spaces.live.com/  does an excellent job of tracking things from the mega-bull point of view.  I prefer the middle of the road long term, with the belief that we're in a bull market that should run for another year or two but will eventually be limited by the enormous debt burden this country is carrying (and continuing to expand).   From an Elliott perspective, that translates into an "X" wave situation as laid out in this chart posted in May:

The Elliott count here has the end of a major bull market cycle dating back to the 1930's ending at the highs in 2000.  That's followed by a nine year corrective cycle that takes the form of a flat and ends at the March 2009 lows.  Since then we are tracing out what should be a three leg "X" wave.  In Elliott, X waves are interim moves which separate multiple stages in an extended and complex corrective series.  The 1970's equity markets are a good example of this type of series.  Back in May it looked like the first, or "A", leg of that X wave was complete at the April highs and that the second "B" leg commenced with a bang that included the May "flash" crash.  The big question for the near term is whether that B leg was complete at the early July lows.  There is a possibility that the selloff that ended at that time was only the first leg of that B wave.
Alternate 1 - Major Wave B done at July lows

Alternate 2 - Major Wave B still in progress

There are a number of arguments favoring a scenario where the market rolls over sometime in the near future.  The first is time proportions - Major Wave A from Mar '09 thru Apr '10 took 14 months, if we accept the late June lows as the end of Major Wave B that's only two months, hardly seems enough.  Another is volume behavior - volume has already been notably absent since the Mar '09 lows, and that situation has been even more pronounced since the interim lows of July 6.

In the above daily charts, the NYSE index is on top and an eight day moving average of total NYSE volume is below.  As can be seen, volume began to decline after the spike at the late May lows and continued declining AFTER the July 6 lows right into early September.  It has increased a little since then, but not significantly.  Certainly not a picture of an overwhelming bull stampede.

Another near term bear argument is that various published sentiment gauges are also showing extremes in bullish sentiment (notwithstanding the lack of volume) - Daneric does a good job reporting on these in his post on Friday.

Finally, the price pattern in recent weeks has been hesitant to say the least.  Although generally trending up, prices are moving in fits and starts typical of an approaching top.  In point of fact, my current ES Elliott count has the market completing a series of 4th and 5th waves of increasing degree.

In the above chart, minor wave 5 (red) and thus major wave C (purple) are shown terminating on Nov 2nd and ushering in the start of  Intermediate Wave C down.  The date is no accident - "buy the rumor, sell the fact".  I believe one of things that's been driving the market up has been anticipation of Republican victories in the November election.

If it is the case that Primary B has another down leg yet to occur, then fibonnaci retrace targets based on the distance traveled of Primary A are as follows:
.382 - ES 1006 (and also = July lows)
.50 - ES 941
.618 - ES 876

Thursday, October 21, 2010

Thursday 10/21/10 wrap up

On the ES, looks like minute wave 5 and thus minor wave 3 (green) are complete at today's highs, with minor wave 4 now in progress.

Since minor wave 2 (green) was a complex irregular flat, then minor wave 4 will most likely be a simple zig-zag or possibly a triangle.  Target would be the areas of the prior 4th waves of lower degree that we saw in the last week, which would be roughly in the ES 1155 - 1165 area.

Thursday 10/21/10 update

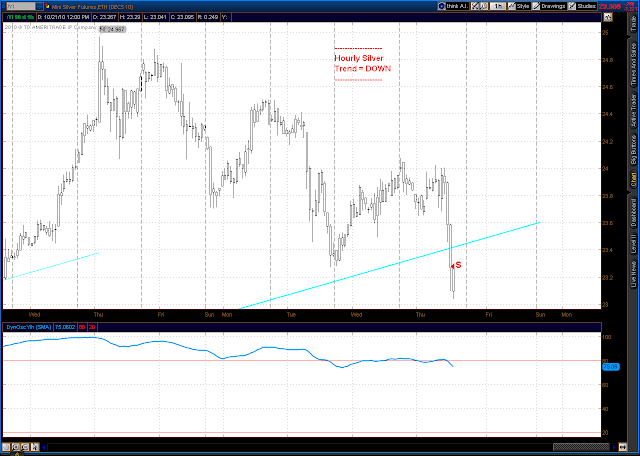
Sell on hourly Silver

Wednesday, October 20, 2010

Wednesday 10/20/10 wrap up

On the ES, looks like minute wave 4 is complete and minute wave 5 in progress.  Minute wave 1 traveled 32.50 points, so with the low of wave 4 at 1155.50 the wave 5 would equal wave 1 at ES 1188.00.

Wednesday 10/20/10 update

Buy signal on hourly EUR, close above downtrend line and Dyn Osc above 20

Tuesday, October 19, 2010

Tuesday 10/19/10 wrap up

ES is in a minute wave 4 if my count is correct, so far it's taking the form of a simple zig-zag which alternates with the complex double zig-zag of minute wave 2 and thus satisfies Elliott rules.  The top of minute wave 1 was 1149.75, so if we should sell off to that level without resuming the rally this count is invalidated.

Trendline/Oscillator Charts
After an extended period when all 5 of the markets followed were solid up on both the hourly and daily charts there's been a lot of action in the last couple of days.

ES - Sell signal again today on the hourly, but this time it's accompanied by a break below the uptrend line on the daily chart.  The hourly sell makes sense in light of the above Elliott count, but that count calls for a couple more wave 4 & 5 sequences before any serious correction occurs, so a sell on the daily chart would be a surprise.  If the Dyn Osc breaks below 80 on the daily and thus generates a sell on that time frame then the above Elliott count will be in serious jeopardy.  For now I'm trusting that the count is correct and planning to go long on a buy signal on the hourly chart. 


EUR/USD - continues in down trend on hourly and edging closer to a sell on the daily.

AUD/USD - generated a sell signal on the hourly today but quite a long way to go on the daily before the daily uptrend line comes into play.

Gold - also generated a sell on the hourly today but still holding in UP mode on the daily chart.  Quite a significant drop in prices in this market in a small period of time, one would expect a nice retrace to say the least.  Looking to go long in this market on a buy signal on the hourly chart AS LONG AS the daily remains in UP mode.


Silver- edging towards a sell signal on the hourly chart.

Tuesday 10/19/10 update

10:15 AM

Sell signal on hourly AUD/US$


8:40 AM

Sell signal on hourly YG (Gold) this morning.

Hourly ES will generate a sell if we see an hourly close below 1169.50 at the top of the hour.

Monday, October 18, 2010

Monday 10/18/10 wrap up

From update posted this morning:
"Pattern on the hourly ES chart since last Wednesday looks very much like a triangle (wedge) which usually precedes a final thrust in the prior direction, so looks like this is a short term long opportunity developing."
Looks like that's exactly what happened today.  In Elliott, a triangle always precedes that the last thrust in a move, and if the below count is right, a sub-minute 5th wave ended at today's highs terminating a move up from the lows of 10/4/10.

From an Elliot wave standpoint the degree of difficulty in the ES over the last month has been extremely high.  Some extended periods of just plain chart mess, especially at the  end of September thru early October, combined with a lot of overlapping waves make the Elliott count very tentative.  Anyway, here's my best guess as to current count:

By this analysis the bull sequence that started at the end of August has three sets of waves 4-5 to go before it is completed.  From a time standpoint that should chew up several weeks to be proportionate.

Meanwhile the daily Trend/Osc ES chart continues to be in UP mode.


The EUR/USD is repeating the pattern we saw last week with prices trading below the uptrend line on the daily Trend/Osc combined with a confirmed downtrend on the hourly Trend/Osc.  This currency pair looks like it's forming a top.  A reading below 80 on the Dyn Osc at a daily close on the daily chart will generate a sell signal for the EUR from that time frame.