I think one of the first adages I learned when I started trading was "The trend is your friend" and of course the corollary "Don't fight the tape". But how does one decide what the trend is, and maybe more importantly, when is the trend changing? That's what the Trendline/Oscillator System was designed to accomplish. I started a description of that for this blog (see sidebar) but haven't completed it. I do intend to finish the write up at some point. But the real guts of the concept are in what I've committed to writing so far. The approach is a fairly simple one, KISS is a great rule, but I know from experience that it is quite effective.
Applying the Trend/Osc to an ES daily chart we see that we are maintaining an uptrend that started in late August. As long as prices stay above the uptrend line connecting the lows of Aug 31 and Oct 4 and the Oscillator stays above 80 we are in bull mode on the daily.

The hourly ES Trend/Osc is also in bull mode since a buy signal of last Tuesday.

The Buy/Sell Vindicator has been showing some excellent entry points during the bull run from late August. It was observed last winter that a reading of 1000 on the dominant trend (Buy line in this case) serves as trend support. In this case, over the last 4 weeks whenever the Buy line got in that 1000 area it was an excellent long entry point. That happened four times in the period as indicated by the highlighted areas.

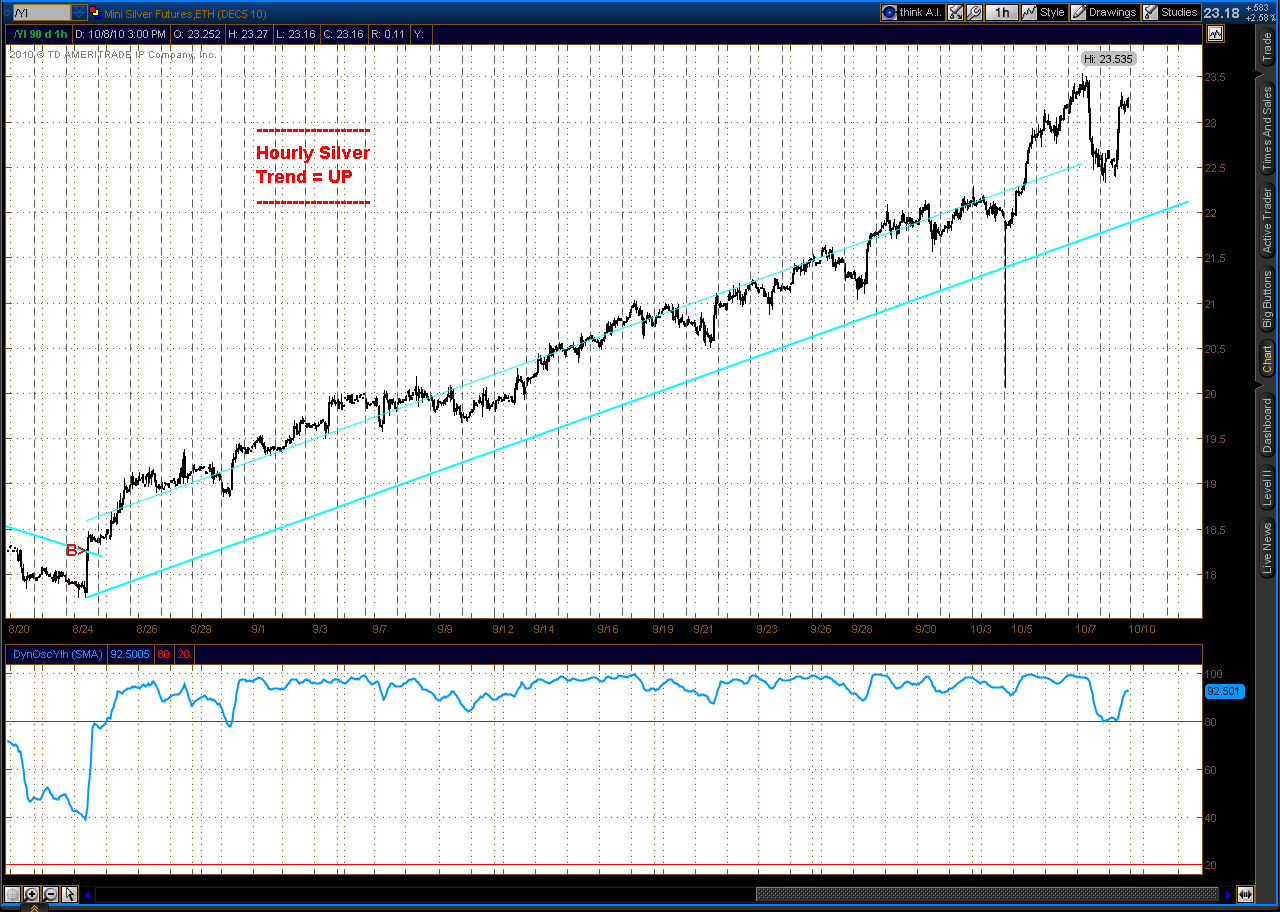
I will be expanding market coverage on this site using the Trend/Osc System. The markets being added are the EUR (Euro/US Dollar), AUD (Australian Dollar/US Dollar), YG (E-mini Gold) and YI (E-mini Silver).
All four of those markets are currently in uptrends on both their hourly and daily charts. Of those four the only one that looks real interesting is Gold. The YG looks like it may be near a downturn on the hourly chart. On Thursday and Friday it sold off and bounced right off the uptrend line connecting the lows of Sep 28 and Sep 30. The pattern of the sell off is in 5 waves so it looks impulsive rather than corrective.