Last night's sell signal on hourly ES is canceled with today's new highs. Comment this morning concerning triangle and anticipated thrust in preceding direction has played out as anticipated.
8:35 AM
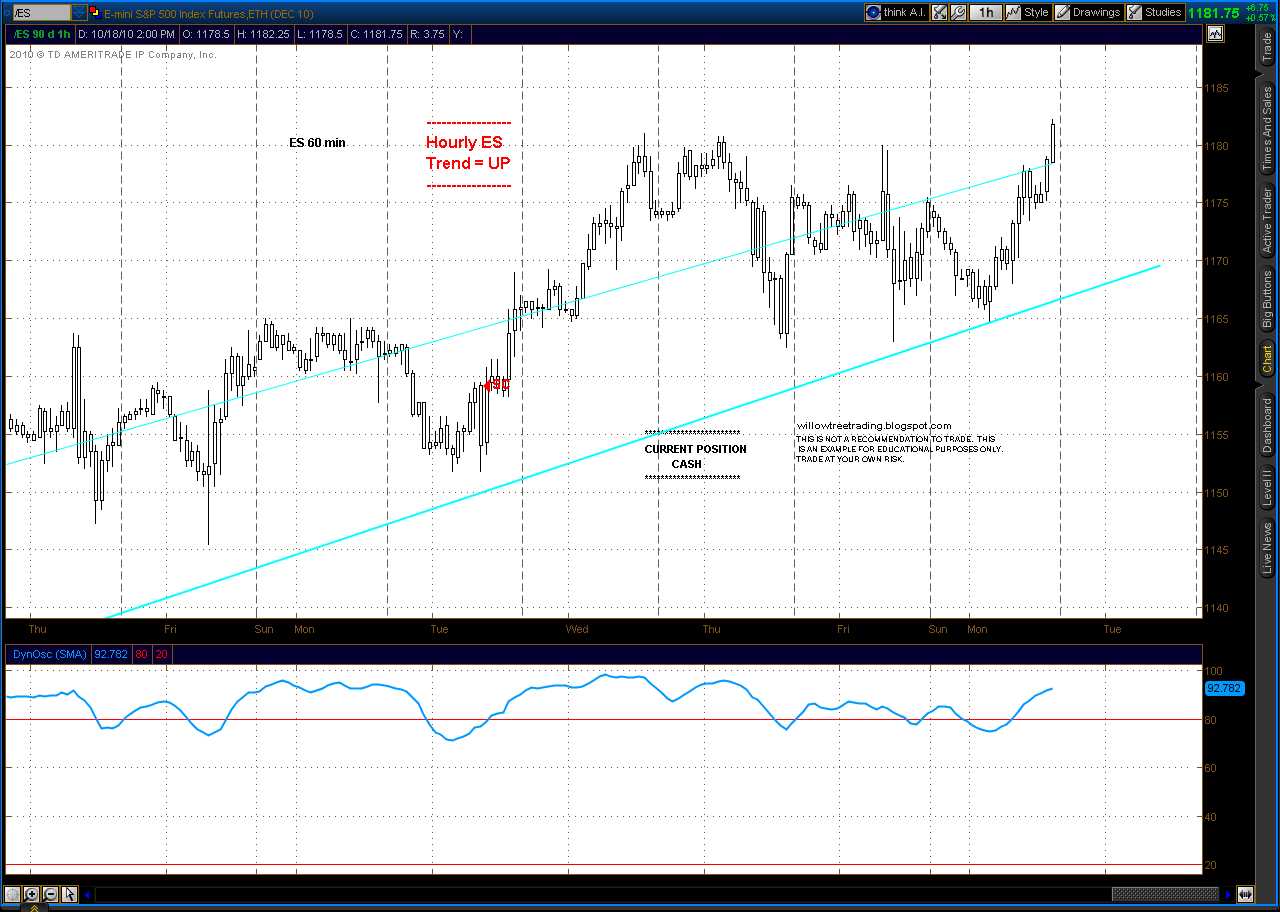
Sell signal on hourly ES overnight when prices closed below uptrend line dating from Oct. 4 - Dyn Osc was already below 80.

However daily ES still showing UP trend.

Pattern on the hourly ES chart since last Wednesday looks very much like a triangle (wedge) which usually precedes a final thrust in the prior direction, so looks like this is a short term long opportunity developing.
