
Thursday, May 31, 2012
Thursday, 5/31/12 late update
It's possible that a wave 2 flat is forming as per below, if so the ES should peak in the 1320 - 1322 area tomorrow AM (in reaction to the employment report?) - note that 1320 is a .618 retrace of the Wednesday - Thursday sell off

Thursday, 5/31/12 update
Updated wave count for ES:

At ES 1276.00 Minor W3 (red) = 4.236 Minor W1, at ES 1269.00 Minute W5 (green) = Minute W1:


At ES 1276.00 Minor W3 (red) = 4.236 Minor W1, at ES 1269.00 Minute W5 (green) = Minute W1:

Tuesday, May 29, 2012

Monday, May 28, 2012
Monday, 5/28/12 update

The pattern in the ES last week following the May 20 low was very corrective looking, especially during the last half of the week. Looks very much like a bear flag. Although anything can happen, this doesn't look like the start of a sustained rally. Odds are that the sell-off of the last couple of months has either resumed last Friday or is close to resuming in the next few days.
The preferred count at the moment is that an extended bear market is underway with eventual targets around the ES 1000 area (see posts of Sunday, 5/21 & Thursday, 5/24). However, there is an alternate that is apparent that has almost equal weight at this time. That alternate has the ES in an ending diagonal "C" wave of a 3 wave structure dating back to the lows of July, 2010. That 3 wave structure is itself part of a larger A-B-C formation since the crash lows of March, 2009.

ZOOMED IN

There's symmetry in this count between Intermediate W2 (purple) and Intermediate W4 (currently in progress). Both are double zig-zags that look quite similar. Intermediate W2 retraced .618 of Intermediate W1 almost exactly, a .618 retrace of Intermediate W3 by Intermediate W4 would be at 1251.50.
If this count is what's going on, then Intermediate W5 will follow with a target near the 2007 high in the upper 1500's. A serious bear market will follow that high. If Intermediate W5 has a slope similar to that of Intermediate W1 that high could occur in Sep - Oct this year, which lands right where market crashes have an historical tendency to occur. This could be quite interesting, not to mention profitable.
There are plenty of intelligent and well spoken bloggers who do an excellent job of outlining the extreme danger the domestic and world financial system is currently facing. So I won't reinvent the wheel. But both the preferred and alternate count here provide for some quite serious economic conflagrations in the very near future. Which is no surprise. Socialism has been proven to be a failure over and over, and the US can now be added to the socialism club in a lot of respects - so the prospect of economic turmoil is to be expected - in fact you have to wonder why it's taking so long to come to fruition.
As Margaret Thatcher once said "The problem with socialism is that eventually you run out of other people's money".
Friday, May 25, 2012

Thursday, May 24, 2012
Thursday, 5/24/12 update
Preferred count in the ES has it in a bear market with an eventual target as low as ES 925.

Since the late March top @ 1419.75 the ES appears to have put in a Minute Wave 1 & 2 down (green) and a Micro waves 1 through 3 (black) of Minute W3, with Micro W4 in progress. Micro W4 is a zig zag which alternates with the flat of Micro W2, an EW requirement.
Target for Micro W4 is between 1333.25 where (c) = (a) of Micro W4 and 1335.00 where Micro W4 = .382 of Micro W3.

If the ES should rally up past 1352.50 this count is invalidated. That level is the low of Micro W1 and pushing up past that point would create an overlap, which is an EW no-no.

The bullish alternate at this point has the ES completing a double zig zag Minor W4 at Sunday night's low of 1287.25. It would now be in Minor W5. This is an unlikely looking count due to the long duration of Minor W4 as compared to the Minor W2 of last December. This count is invalidated by a drop below 1266.25, the peak of Minor W1. A drop below that level would create an overlap.

Sunday, May 20, 2012
Sunday, 5/21/12 update
ES/SPX
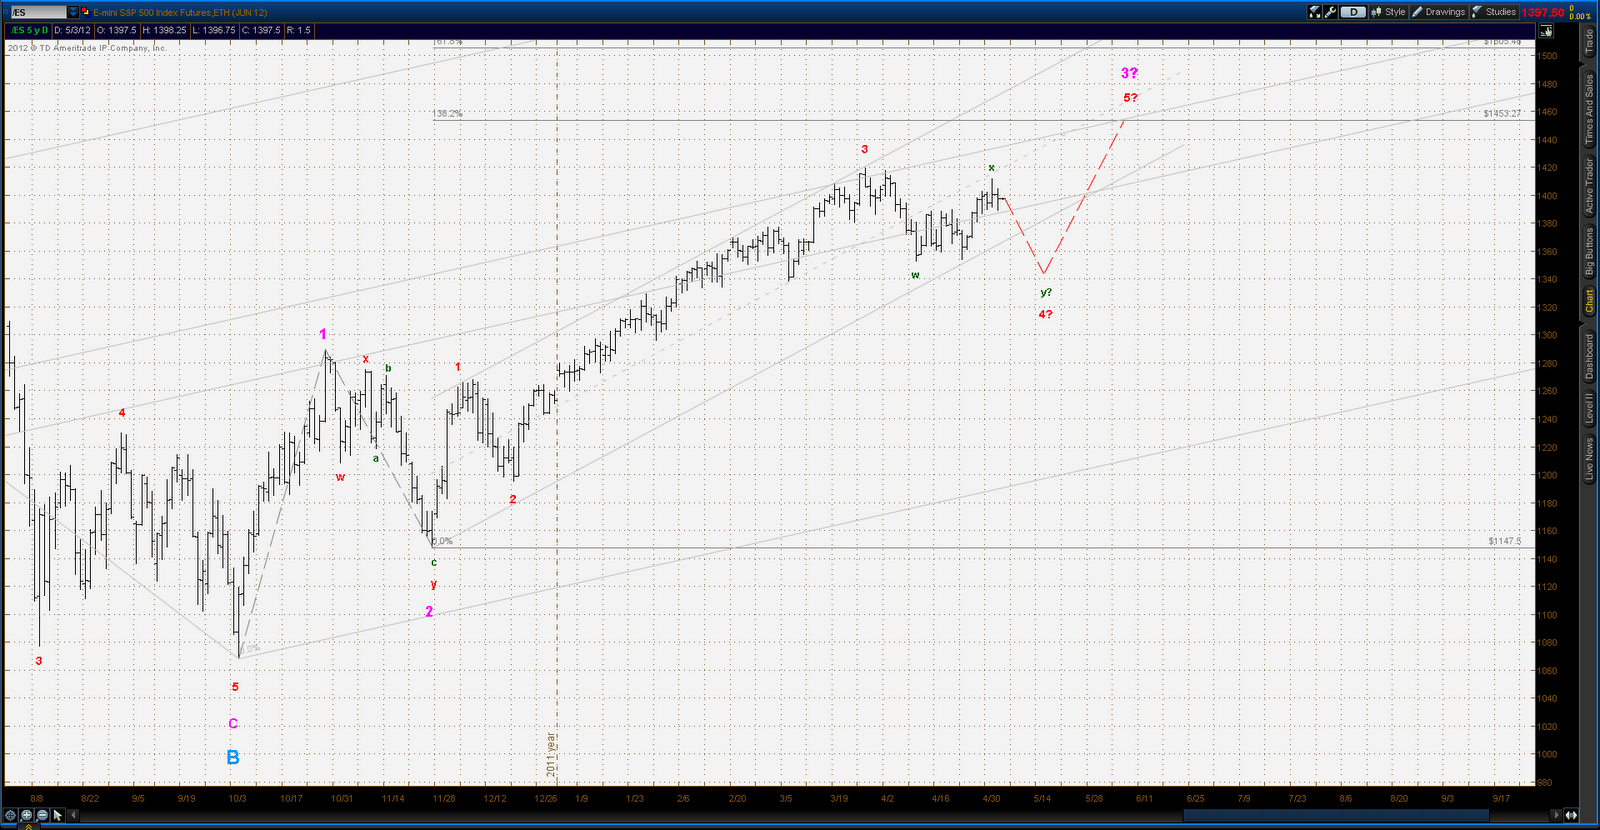
An alternate EW count that I've been considering for some time now has moved up to the preferred count with last week's selling. This count envisions a 3-3-5 flat structure dating back to the highs of May, 2011. The A leg bottomed on Oct 4, 2011 at ES 1068 and the B leg topped on Mar 27 at ES 1419.75. The C leg has been in progress since that time. It should be a 5 wave impulse structure and, since it's a 3rd wave (C of an A-B-C), it should be pretty strong. Fibonnaci targets for the move are at ES 1020 and then in the ES 925 to 936 area.

From a shorter term perspective the ES appears to have completed two wave 1 & 2 series since the March high and could well be closing in on the bottom of wave 3 of the second series.

Wave 3 in this count may be close to conclusion because the market is currently at very oversold levels. Note however that markets can maintain oversold (or overbought) levels for far longer than seems reasonable, so this thought is a "definite maybe". One thing I watch for clues for a bottom is a daily indicator I came up with some years ago (1987 to be exact). It's a mish-mash of Adv/Dec, volume and some other odd statistics that does a fairly decent job of signalling market bottoms. A reading on this indicator below .50 is a pretty reliable signal of a bounce in the near future. That signal is usually good for at least 5 days of rally, sometimes a lot more. It dropped below .50 last Tuesday and currently is at .304.

An hourly close above the downtrend line of the selling since May 1 would be a pretty good indicator that the bottom is in. That downtrend line is currently around the 1330 level and dropping at the rate of about 6 points per day.

Back to the longer term view, there is an apparent 67 week cycle in the ES/SPX that Albertarocks has identified which is worth watching. I usually am not a big fan of market cycle stuff, but this one looks impressive. It last bottomed during the 1st week of last October and is due to bottom again the 1st week of January, 2013. This would certainly provide enough time for the ES/SPX to get to the target levels of the preferred count mentioned earlier.

GOLD
Gold looks like it bottomed last Thursday. It broke above the downtrend line from it's high of May 1 and has put in a very impulsive looking pattern since the Thursday low.

A change in trend for gold would be confirmed by a break above the downtrend line from the Feb 29 high on the daily chart. That downtrend line is currently at about 1635 and dropping at the rate of roughly 13.50 points per week.

From an EW point of view, the apparent bottom last week could well be the conclusion of a 4th wave in a 5 wave structure dating from Oct 2008. If so, the 5th wave would be in progress and should at a minimum match the 3rd wave high at 1923.70.

A bull market in gold fits nicely with the idea of a bear market in equities: fear would be the driver in both cases.
Thursday, May 17, 2012
Thursday, 5/17/12 update
I've been traveling on business this week since Monday, so I only have time to check markets in the evening on my laptop. For some reason this thing won't let me get into the disqus comment section on my blog, it's also doing other flaky things that are getting me nuts, can't wait to get home and get back on my desktop PC.
Gold had an upside breakout today as per the discussion in yesterday's post. This ramp up today has an impulsive look to it, so it quite possibly is a major turn in the gold market. If so, it invalidates the Elliott count presented yesterday. Don't have time this evening to re-visit that analysis, perhaps over the weekend.

Gold had an upside breakout today as per the discussion in yesterday's post. This ramp up today has an impulsive look to it, so it quite possibly is a major turn in the gold market. If so, it invalidates the Elliott count presented yesterday. Don't have time this evening to re-visit that analysis, perhaps over the weekend.

Wednesday, May 16, 2012
Wednesday, 5/16/12 update
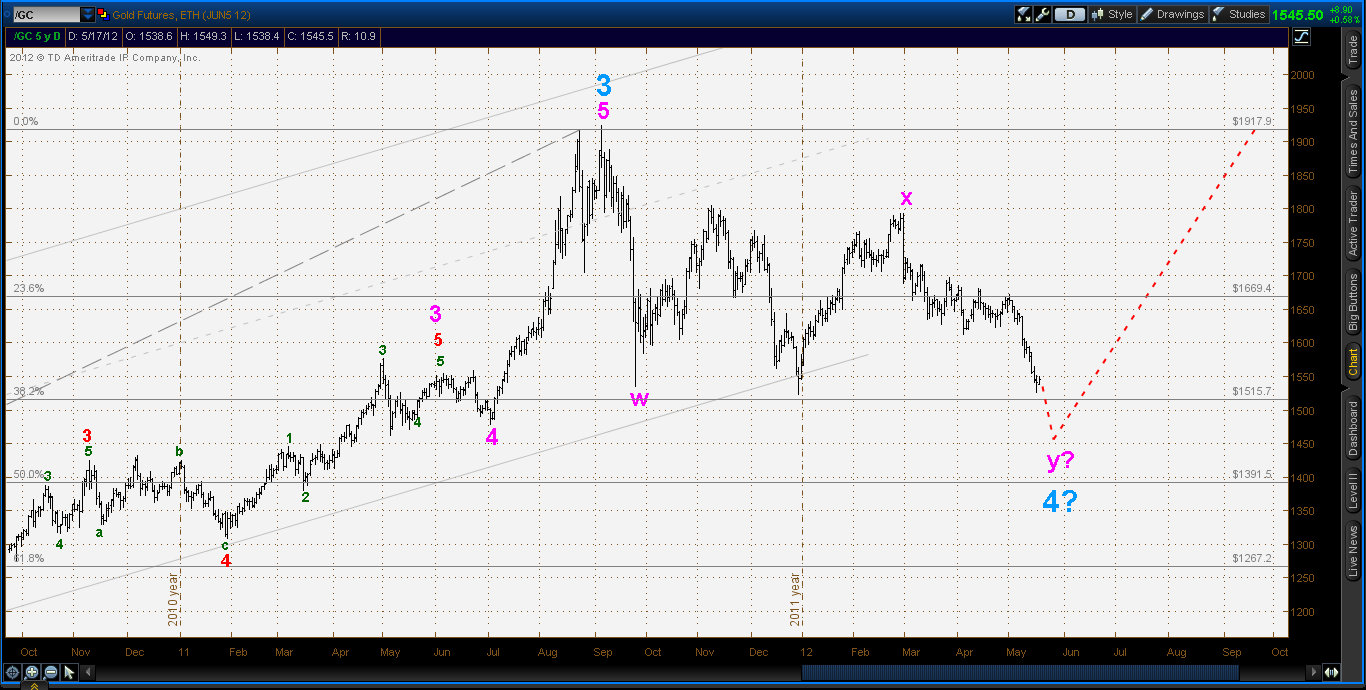
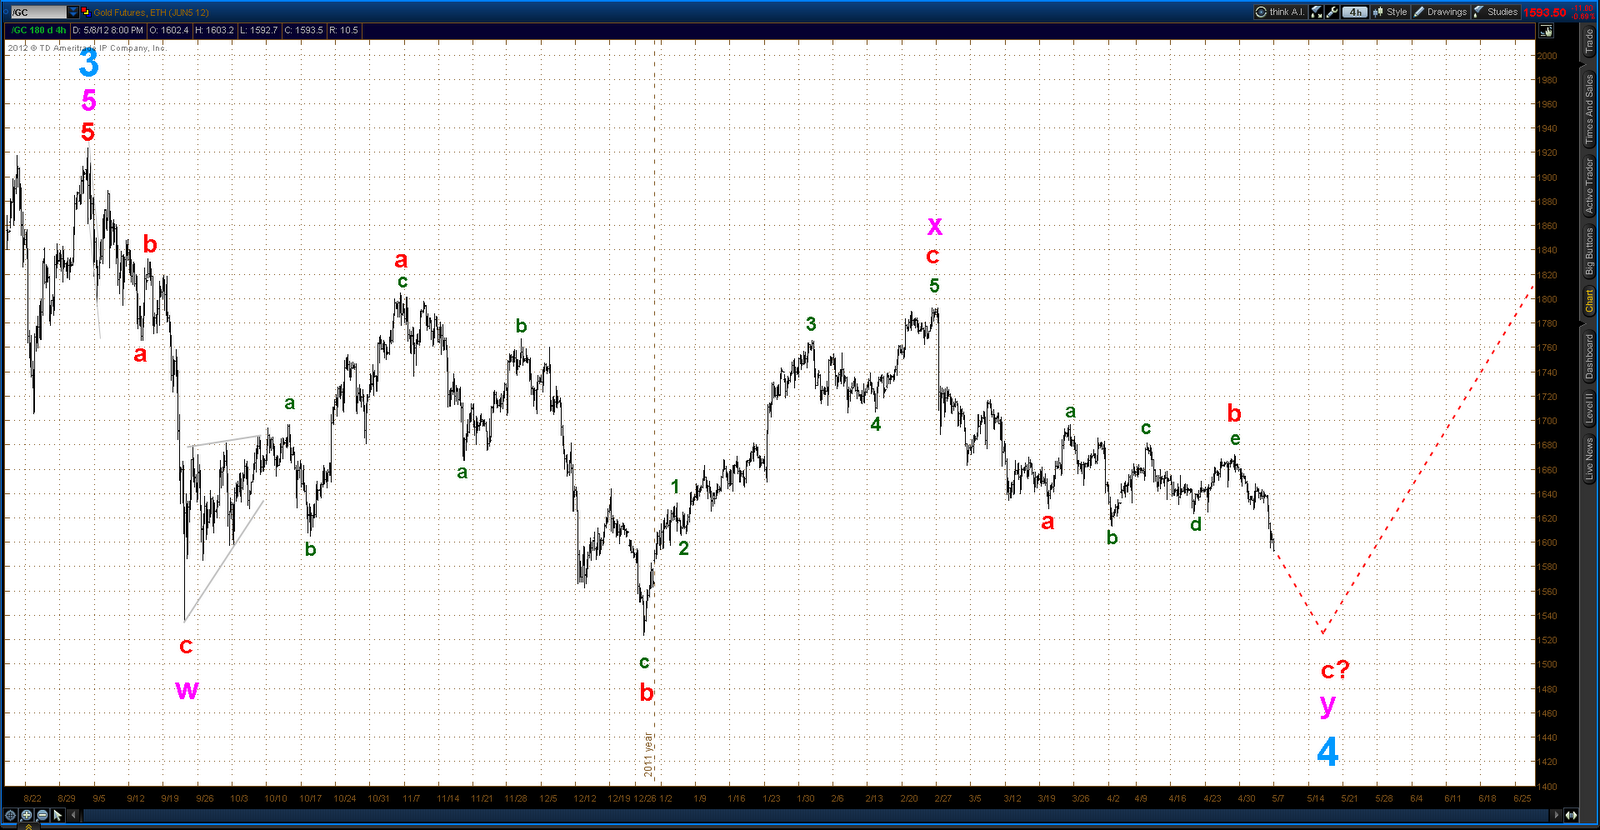
The two possibilities for gold discussed in the May 8 update have been narrowed down to one, and that is that a Major W4 correction from last year's Major W3 high is still in progress. This count has a double zig-zag forming from that Major W3 top with the second of those zig-zags starting at the high of Feb 28. Further, the action since Feb 28 has already formed the A and B legs of the structure with the C (and thus final) leg in progress since May 1. However, at this point the internal structure of this C wave appears to indicate that it has a distance to yet travel:

Please note that the projected market path represented by the red dotted lines is conceptual only, it is not intended as a prediction of price targets. What it is saying is that when applying Elliott rules to the pattern it appears that Minute W3 (green numbers) from the May 1 high has not yet concluded, and when that happens there still will be a Minute W4 & W5 necessary to complete the pattern.
Here's what it looks like from a longer term perspective, 1st chart is 4 hour bars and 2nd is daily:


So how to to determine the conclusion of Minor C, Intermediate Y & Major W4? A break up out of the channel established from the May 1 high would be a very good indicator of that bottom either being achieved or close at hand.


Please note that the projected market path represented by the red dotted lines is conceptual only, it is not intended as a prediction of price targets. What it is saying is that when applying Elliott rules to the pattern it appears that Minute W3 (green numbers) from the May 1 high has not yet concluded, and when that happens there still will be a Minute W4 & W5 necessary to complete the pattern.
Here's what it looks like from a longer term perspective, 1st chart is 4 hour bars and 2nd is daily:

So how to to determine the conclusion of Minor C, Intermediate Y & Major W4? A break up out of the channel established from the May 1 high would be a very good indicator of that bottom either being achieved or close at hand.

Tuesday, May 8, 2012
Tuesday, 5/8/12 update
I've been asked for my thoughts on gold. I don't follow that market as closely as the ES/SPX, but it is a market that I occasionally trade, so here goes.
Most wavers that I'm familiar with are in agreement that the highs in the $1920 area of last year marked the top of a 3rd wave of a bull market dating back to the Oct 2008 lows. Since that high gold would be expected to trace out a 4th wave followed by a 5th wave to a top at or above the $1920 highs.


A couple of things to note in the charts: 1) the Major Wave 2 (blue) correction of early 2009 was a simple zig-zag, so by the Elliott rule of alternation Major Wave 4 should be a flat, triangle or some type of complex corrective sequence. Major Wave 4 from the Aug 2011 top looks to be a triple zig-zag, which meets the requirements; 2) The Major W4 low of 1523.90 on Dec 29 was inches from the .382 retrace of Major W3 at 1515.70.
Since that low gold has put in a clear 5 wave impulse to the high of 1792.30 on Feb 29 followed by a choppy corrective looking decline into the current lows. The Feb 29 high is potentially the top of Intermediate Wave 1 of Major W5, and the selling since would thus be Intermediate W2. However, that W2 is cutting pretty deep. It has dropped through the .618 retrace of Inter W1 at 1626.60 with authority. The next fibonnacci retrace level is at .786 of Inter W1 at 1581.40.
If gold drops through that level another very unlikely looking alternate may be in play, which is that Major W4 was not over at the Dec 29 low and is still in progress. This involves quite a lot of changes to the chart as per below. The target drawn in the chart is the 1520 area that provided support in December, but under this scenario gold could drop significantly below that.

Note: the hourly charts are actually 4 hour bars
Most wavers that I'm familiar with are in agreement that the highs in the $1920 area of last year marked the top of a 3rd wave of a bull market dating back to the Oct 2008 lows. Since that high gold would be expected to trace out a 4th wave followed by a 5th wave to a top at or above the $1920 highs.
DAILY

HOURLY

A couple of things to note in the charts: 1) the Major Wave 2 (blue) correction of early 2009 was a simple zig-zag, so by the Elliott rule of alternation Major Wave 4 should be a flat, triangle or some type of complex corrective sequence. Major Wave 4 from the Aug 2011 top looks to be a triple zig-zag, which meets the requirements; 2) The Major W4 low of 1523.90 on Dec 29 was inches from the .382 retrace of Major W3 at 1515.70.
Since that low gold has put in a clear 5 wave impulse to the high of 1792.30 on Feb 29 followed by a choppy corrective looking decline into the current lows. The Feb 29 high is potentially the top of Intermediate Wave 1 of Major W5, and the selling since would thus be Intermediate W2. However, that W2 is cutting pretty deep. It has dropped through the .618 retrace of Inter W1 at 1626.60 with authority. The next fibonnacci retrace level is at .786 of Inter W1 at 1581.40.
If gold drops through that level another very unlikely looking alternate may be in play, which is that Major W4 was not over at the Dec 29 low and is still in progress. This involves quite a lot of changes to the chart as per below. The target drawn in the chart is the 1520 area that provided support in December, but under this scenario gold could drop significantly below that.
Note: the hourly charts are actually 4 hour bars
Monday, May 7, 2012
Monday, 5/7/12 update
There are several possibilities for ES Elliot counts at this juncture.
1st is that the low last night was a selling climax to a double zig-zag 4th wave that started in late March. The ES would thus be expected to rally to new highs in a 5th wave over the coming days.


The 2nd possibility is that the double zig-zag is not yet complete.

Finally it could be that the selling since late March is only the early stages of a pretty serious bear market and that there is thus a lot more yet to come. This needs to be given serious consideration for a whole host of reasons. One of those is what's happening in commodities as Albertarocks has pointed out in a recent post.


1st is that the low last night was a selling climax to a double zig-zag 4th wave that started in late March. The ES would thus be expected to rally to new highs in a 5th wave over the coming days.
Hourly

Daily

The 2nd possibility is that the double zig-zag is not yet complete.
Hourly

Finally it could be that the selling since late March is only the early stages of a pretty serious bear market and that there is thus a lot more yet to come. This needs to be given serious consideration for a whole host of reasons. One of those is what's happening in commodities as Albertarocks has pointed out in a recent post.
Hourly

Daily

Wednesday, May 2, 2012
Wednesday, 5/2/12 update
The bullish perspective on the ES here would be to consider the rally up from the Apr 23 low into Monday's high to be a 1st wave of a impulse to new highs. In that case, the ES has already traced a zig-zag move down to today's low at 1389.25 which would be perfectly acceptable as the 2nd wave of the sequence. However, the bounce since that low has been much more corrective than impulsive, so it's quite possible that another zig-zag could occur before the correction is over.

There are two bearish alternates at the moment to be considered. In both cases the high on Monday would be considered the C wave of a 3-3-5 flat correction that started at the Apr 10 low. In these cases it would be down from here. The 1st chart below is the more likely bearish alternate IMHO.


There are two bearish alternates at the moment to be considered. In both cases the high on Monday would be considered the C wave of a 3-3-5 flat correction that started at the Apr 10 low. In these cases it would be down from here. The 1st chart below is the more likely bearish alternate IMHO.
Alternate 1
Alternate 2

Subscribe to:
Posts (Atom)
