Most wavers that I'm familiar with are in agreement that the highs in the $1920 area of last year marked the top of a 3rd wave of a bull market dating back to the Oct 2008 lows. Since that high gold would be expected to trace out a 4th wave followed by a 5th wave to a top at or above the $1920 highs.
DAILY

HOURLY

A couple of things to note in the charts: 1) the Major Wave 2 (blue) correction of early 2009 was a simple zig-zag, so by the Elliott rule of alternation Major Wave 4 should be a flat, triangle or some type of complex corrective sequence. Major Wave 4 from the Aug 2011 top looks to be a triple zig-zag, which meets the requirements; 2) The Major W4 low of 1523.90 on Dec 29 was inches from the .382 retrace of Major W3 at 1515.70.
Since that low gold has put in a clear 5 wave impulse to the high of 1792.30 on Feb 29 followed by a choppy corrective looking decline into the current lows. The Feb 29 high is potentially the top of Intermediate Wave 1 of Major W5, and the selling since would thus be Intermediate W2. However, that W2 is cutting pretty deep. It has dropped through the .618 retrace of Inter W1 at 1626.60 with authority. The next fibonnacci retrace level is at .786 of Inter W1 at 1581.40.
If gold drops through that level another very unlikely looking alternate may be in play, which is that Major W4 was not over at the Dec 29 low and is still in progress. This involves quite a lot of changes to the chart as per below. The target drawn in the chart is the 1520 area that provided support in December, but under this scenario gold could drop significantly below that.
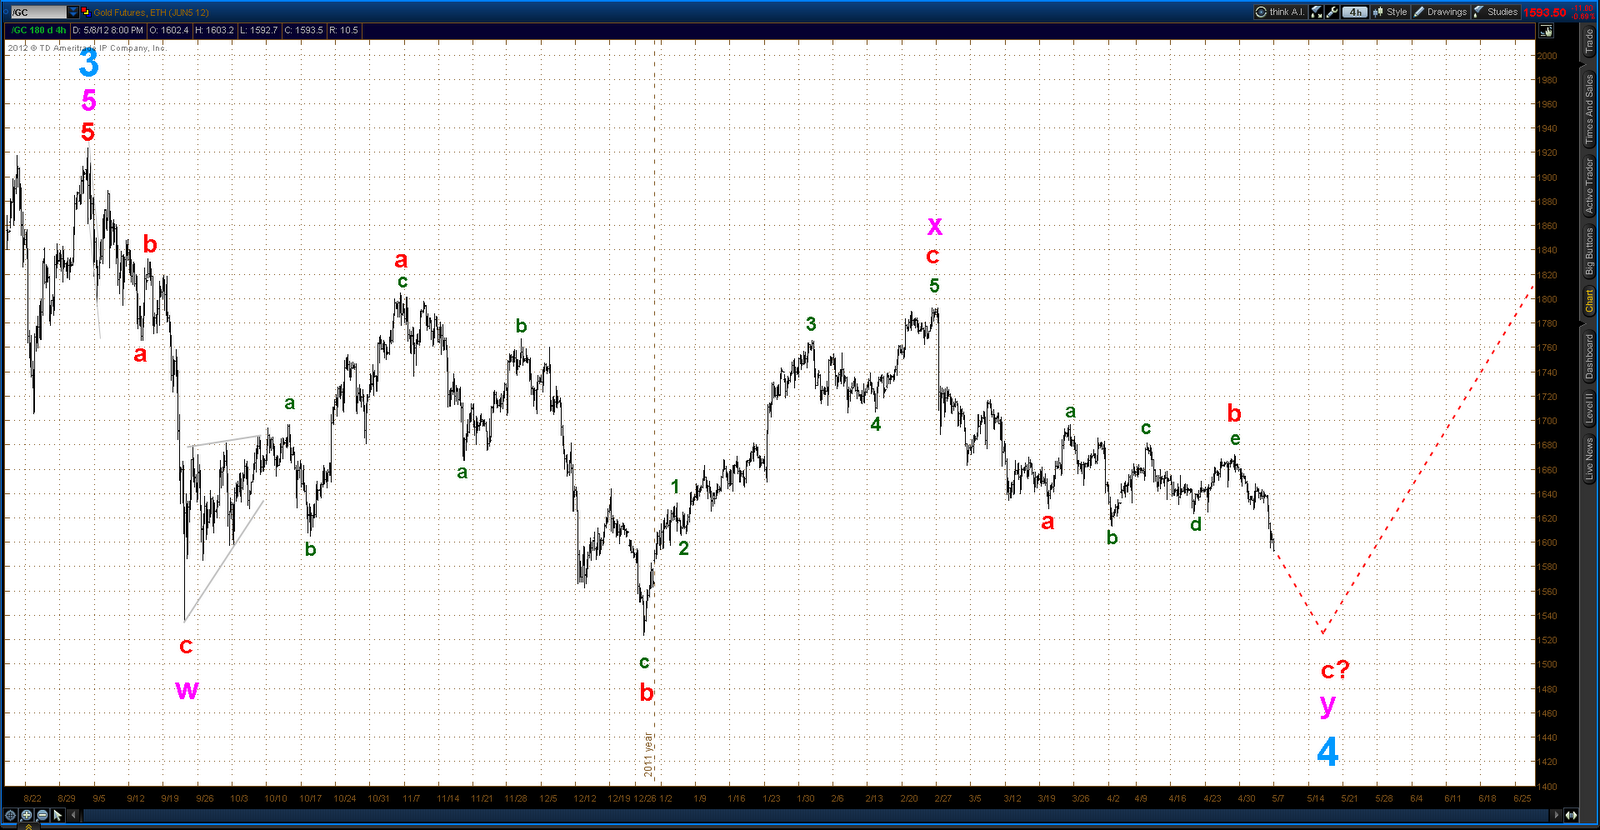
Note: the hourly charts are actually 4 hour bars
