
Please note that the projected market path represented by the red dotted lines is conceptual only, it is not intended as a prediction of price targets. What it is saying is that when applying Elliott rules to the pattern it appears that Minute W3 (green numbers) from the May 1 high has not yet concluded, and when that happens there still will be a Minute W4 & W5 necessary to complete the pattern.
Here's what it looks like from a longer term perspective, 1st chart is 4 hour bars and 2nd is daily:

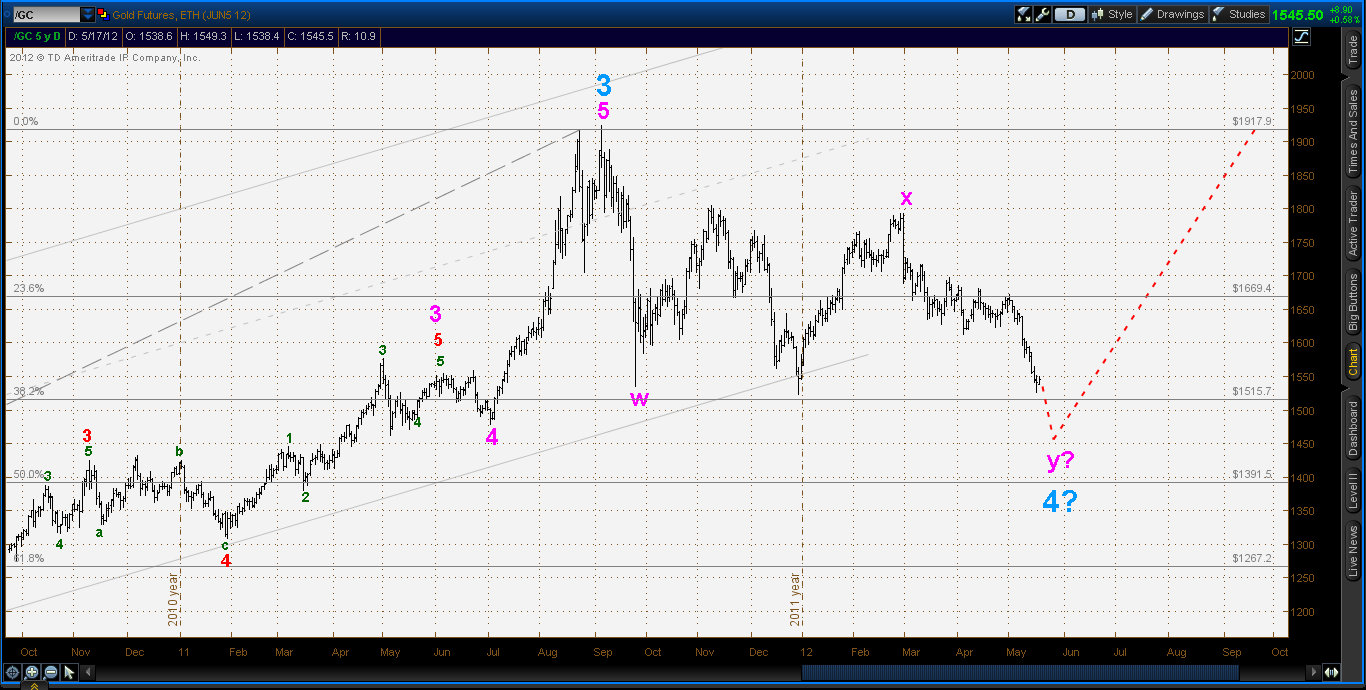
So how to to determine the conclusion of Minor C, Intermediate Y & Major W4? A break up out of the channel established from the May 1 high would be a very good indicator of that bottom either being achieved or close at hand.


Does today's action indicate the break up out the channel? Does it indicate the Major W4 is done?
ReplyDelete