skip to main |
skip to sidebar
CURRENT CHARTS
Click HERE to view current charts
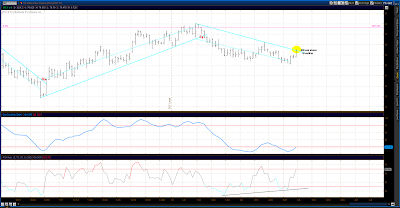
The SPX/ES has been in a slow upward grind in the last two weeks. The best current count has it in a Minute Wave 5 of a Minor Wave 3 rally that started on Dec 19. As a 5th wave of a rally that is in it's 3rd month and that has seen a price appreciation of around 15% in that space of time, and also with prices in the exact same area that turned the market south last May, it's no surprise that the market is struggling. The best way to count this wave is as an ending diagonal, with waves 1 thru 4 of that structure in place and the 5th and final wave itself nearing completion. Thus a top for Minor W3 finally appears to be close at hand.

Markets usually need a precipitating event to roll them over, and that event at this juncture could well be a major turn up in the value of the US$. The DX has broken above it's downtrend line on Friday, the 1st necessary step in a rally. Follow through and confirmation are yet to come. Equity values and the value of the US$ has tended to show an inverse correlation in recent years, so this could be the trigger for the bear in equities.


Great post Apple Al,
ReplyDeleteI wanted you to know that I am still following your blog regularly. Thanks for the write up on the ES hourly chart regarding the current wave count.
I found a site that has an alternate count to yours. They say that we are in a 5-wave Primary cycle out of the March 2009 lows. Currently, Primary III, Major 3, Intermediate 1, All smaller waves are 5th waves.
Let me just ask you, why is this an ABC primary wave instead of a 5-wave primary cycle? What is the distinction?
Is your wave 4 target based on wave 3 length?
I am leaning toward your count. My trading strategy has mainly utilized trend lines and one thing I have learned is that once a primary trend line is breached to the downside, there is usually ~1.5 yrs or so of a downtrending market.
I like big picture thinking. 1983 to 2000 was a huge bull market. The last Secular Bear market was from 1966 to 1982 and there was sideways movement through the entire period (1966: S&P = 92, 1982: 109). There were 3 higher highs and 3 lower lows from 1966 to 1975. I wonder if history will repeat itself? If so, then we might see all time high before dropping off of a cliff sometime before 2020.
Thanks for keeping this blog going.
Aaron
In Elliott Wave at its most basic a three wave move is corrective to a trend and a 5 wave move is a component of a trend, i.e. with the trend: 5 waves, against the trend: three waves.
ReplyDeleteI believe that the top in equities in 2000 was actually the top to a 68 year bull market that dated back to 1932. Since then we've been in a multi-year correction to that run. So far we've seen a 9 year correction to that run in the form of a flat: 2000 - 2002 = Wave A, 2002 - 2007 = Wave B, 2007 - 2009 = Wave C. The big question is whether the low in Mar 2009 was the end of that correction. If not, then we should see a 3-wave (ABC) "X" wave followed by another 3 wave bear market that will eventually challenge or exceed the lows of Mar, 2009. If it was the end of that correction, then we should expect 5 wave structures going up from there to who knows where. And that's the difference between my Primary count and the other to which you refer. I believe the bear market sequence that corrects against the 1932 - 2000 bull is not yet over, the analyst to which you refer does believe it was done in 2009. Thus I have corrective ABC's on my charts, the other guy has impulsive 5 wave labeling.
In defense of my position:
1) We had 68 years of bull market, is 9 years enough time to fully correct against that trend?
2) Over that 68 year period, and indeed on an ongoing basis, the USA has gorged itself on debt to the point of morbid obesity. I have a hard time envisioning an ever onward and upward path for our financial markets until we shed the weight of that debt. And shedding that debt will almost certainly entail another round of severe financial turmoil.
Is that other site Tony Caldero? I believe the count you refer to is his count. If it is, I have to say I have that utmost respect for his work, in fact I read his site every day. I just don't agree with his long term count. But he could well be correct.
Finally, yes my Wave 4 target is based on the Wave 3 length.
Hi Al,
ReplyDeleteYes, it is Tony's site. I clicked on the link on the right side of your blog and then read his summary.
In the two short years that I have been trading, I have learned that the market has been manipulated by the Fed thru QE and other forms of liquidity.
As you said, Time will come to pay the piper.
Thanks for replying to my post.
Aaron