ES
After hours of intense study and analysis, I've finally identified what's going on in equities: it's a bull market.
Just kidding.
Hard dump in the ES in this morning's abbreviated session, possibly we've seen the termination of Minor W5 (red) of Intermediate W5 (purple) of the forever rally that started last July. With the continued unrest in the Mideast possibly we have the trigger for a major correction.
ES - hourly
But, as usual, there are alternates. The most likely alternate is that Intermediate W5 is extending with only Minor W1 & W2 complete and Minor W3 not even half done. This would call for a lot more upside before any sort of breather. As relentless as this market has been, this alternate is quite possible.
ES - hourly - alternate count
AUD/US$ (futures)
Long Term the AUD has been in a bull market since lows in Oct 2008. From those lows it rallied into a Major Wave "A" top in early 2010, then dropped to a Major Wave "B" bottom in May, 2010 and has been in a Major Wave "C" rally since that time.
AUD - daily
At this point there are two main alternates for the AUD, the first is as shown above. In it the AUD has just completed a Minor W4 triangle formation that commenced at the high of early Nov. It is thus in Minor W5 on the way to an Intermediate W1 top. Based on some fibonnaci analysis it appears that a likely target for that top is the 1.07 area.
AUD daily - 1st alternate
Aud hourly - 1st alternate
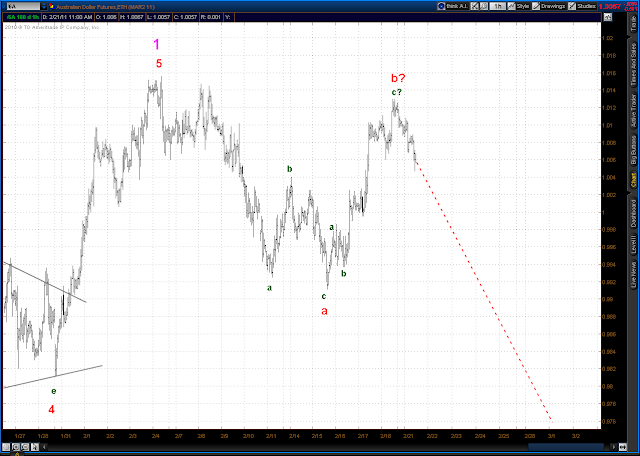
The second alternate shows Intermediate W1 complete at the high of Feb 4 with Intemediate W2 in progress.
AUD daily - 2nd alternate
Since that Feb 4 top the AUD has put in the first leg down of Intermediate W2, that leg is labeled Minor Wave "a" (red) in the below chart. Minor Wave "b" is in progress since then, and quite possibly complete at last Friday's high. If so we should continue down from here.
AUD hourly - 2nd alternate
So how can we tell which alternate is the correct one? If the AUD rallies strongly up through the high of 1.0168 established in late Dec then alternate 1 is most likely correct. However, if the AUD drops below the top of the first leg up in the current rally from Feb 15 then alternate 2 is probably correct. That short term top was at .9978. So a break above 1.0168 or below .9978 should resolve the question.
Monday, February 21, 2011
blog comments powered by Disqus
Subscribe to:
Post Comments (Atom)


