I will not be able to post every day this week and will most likely not be trading, events have conspired to give me what might be termed "calendar overload". Should calm down some next week.
First chart is just something to ponder. It's a weekly SPX chart of 1994 and 1995. There was a mid-term election in 1994. Clinton was President and had a Democratic Congress in 1993 and 1994, the Republicans swept the election based on wide spread disapproval of Democratic policies and wrested control of Congress away from the Democrats. Sound familiar?
I'm compelled to once again point out today's tepid volume. In August we heard the low volume was typical and the result of summer holidays. Last week we heard that the low volume was due to Labor Day and the Jewish New Year. What's the reason today?
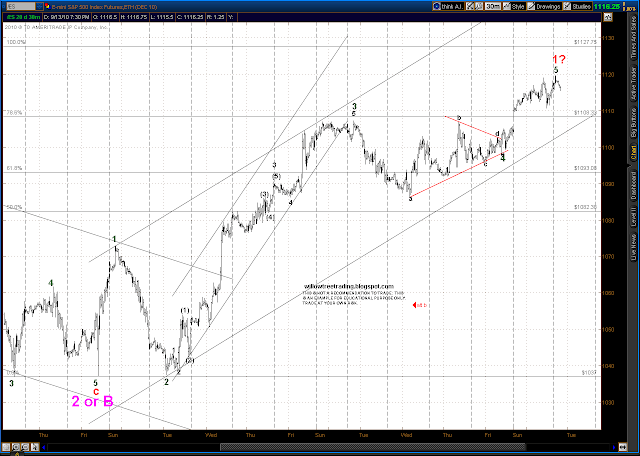
The price pattern in the ES last week was very choppy and consisted of 3 wave moves in both directions. It appears very much to be a wedge or triangle type pattern.
In EW theory triangles always precede the last leg of a move, so from a larger perspective the most likely count looks like this:
If this is correct, and it is a big IF, then we should finally see a more serious correction to the rally that started at the end of August.
Trendline/Oscillator is still in bull mode and will stay so until such time as prices break below the (blue) up trend line accompanied by a break below 80 on the Dyn Osc.
Monday, September 13, 2010
blog comments powered by Disqus
Subscribe to:
Post Comments (Atom)


