
From a longer term perspective, there are three possibilities worth mentioning. My preferred count is a bearish one, and under it we have just completed the C leg of a Wave 2 correction and are tipping over into a Wave 3.

There is another near term bearish, longer term bullish possibility which popped out at me this weekend, and that is that we have been building an A-B-C-D-E triangle or wedge since the highs in April, with the D leg just complete and the E leg just started. This E leg would mark the end of a multi-month corrective sequence and would usher in a multi-month rally that should equate to the advance of March '09 through April of this year.
In order for this scenario to hold true we must immediately roll over.

The bullish alternate is that an intermediate Wave 2 ended at last Tuesday's lows and that we are just wrapping up Wave 1 of an intermediate Wave 3.

From a trading standpoint there is no effective near term difference between the triangle scenario and the bullish scenario, they both call for a relatively short lived (3 - 5 days) pullback to a level not lower than last Tuesday's lows which would be followed by a long term rally sequence.
On the Trendline/Oscillator System we could very easily see a drop below the down trend line that currently defines the rally from last Tuesday. If accompanied by a drop below 80 on the Dynamic Oscillator we would have a sell signal. There is every possibility that this could happen overnight tonight. We are certainly due some sort of pullback after the relentless rally of the last week.
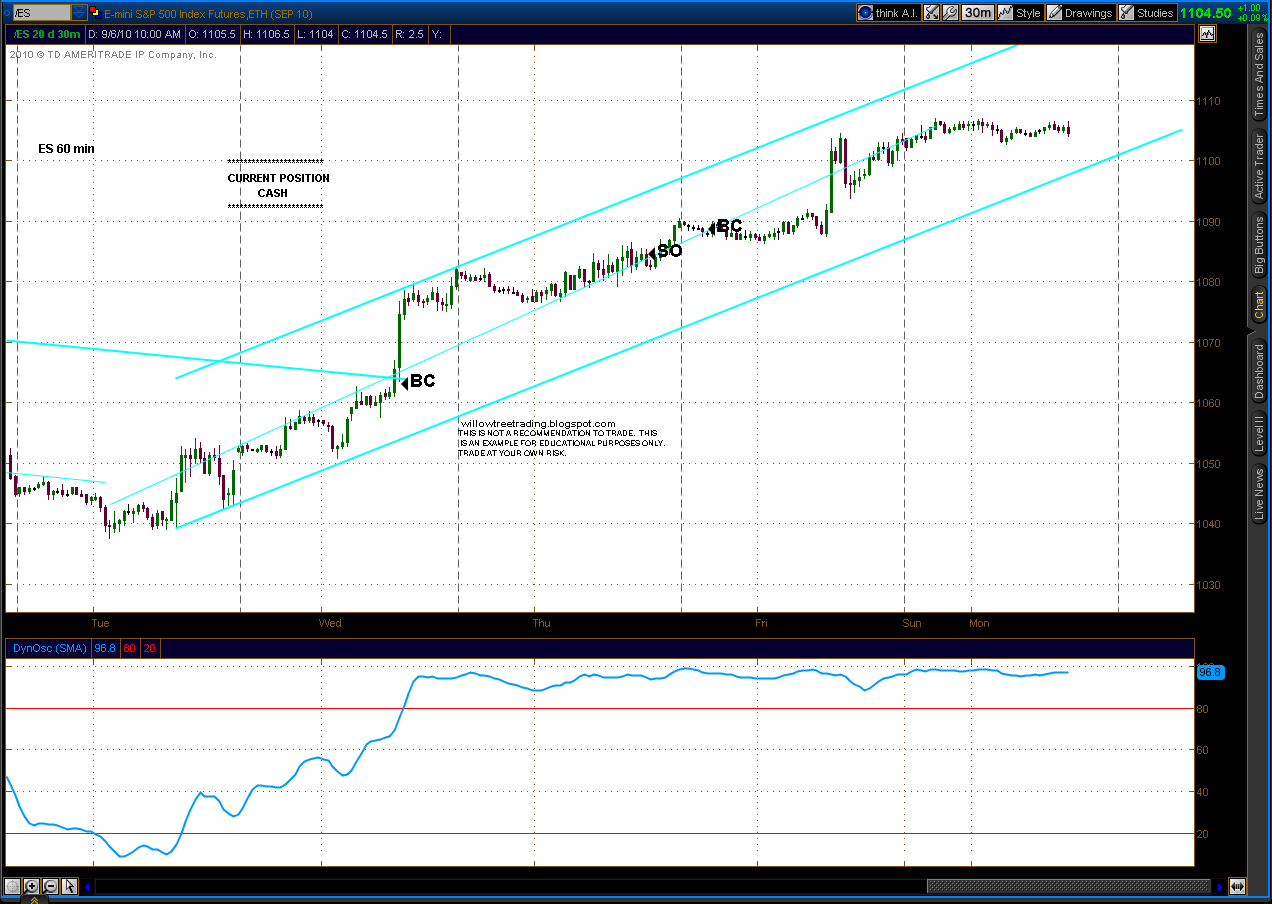
I'm seriously considering shorting ES at tonight's open with a stop a tick or two above the recent high of ES 1107.00. The close this morning of the abbreviated holiday session smelled like a top.

