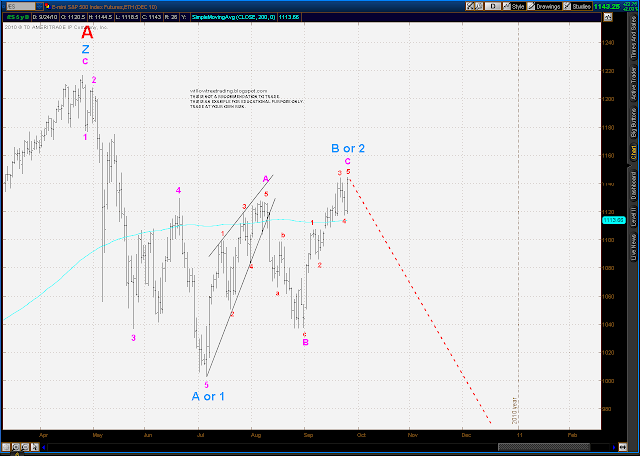
As usual, there are several alternatives here that are apparent, two intermediate term bullish and one bearish. Intermediate term my preference tends to the bullish side. I've recently applied the Trendline/Oscillator approach to an ES daily chart, and that shows us solidly in bull mode at this point with prices above an uptrend line from the early month lows and the Dynamic Oscillator tracking above 80.0.
I'm sure a lot of folks will agree that Friday's rally was a surprise. Although the choppy and overlapping nature of Wednesday's and Thursday's selling was clearly corrective in nature, two days of selling hardly seems enough to work off the excesses of the 16 solid days of relentless rally that preceded it. In addition, the bottom on Thursday only represents a .236 retrace of that rally, which is pretty shallow.
Zooming in on the above chart, if we have in fact seen the extent of the correction, then Wednesday and Thursday are best labeled as a zig-zag 2nd Wave with Friday a sub-wave 1 almost complete, so another quick correction should be in order early next week immediately followed by a strong sub-wave 3 rally.
However, we were quite overbought as of close Friday on an hourly basis, and the shortness and shallowness of the midweek correction suggests the distinct possibility of one more deeper corrective leg to set up a strong rally. In this case we are tracing out a flat style correction with the "A" leg done at Thursday's low and the "B" leg complete or almost complete, with a strong and impulsive looking "C" leg dead ahead. If this develops, look for that "C" leg to find support at the .382 level around ES 1103 or, more likely, the .50 level around ES 1090. ES 1090 in particular has been important resistance/support in recent history.
There is an intermediate term bear case which needs consideration, and that viewpoint shows us at a potential significant top as of right now. In that view the early July lows marked the end of a 5 wave leading diagonal Major Wave A or 1, and we have since been in a Major Wave B or 2. That Wave B is taking the form of a 5-3-5 zig zag, with wave 5 of the C leg complete or almost complete as of Friday's close. If this is correct, look out below.
One other thing to address which is a longer term concern is the continuing lack of trading volume. I've tracked volume, a/d and other statistics for many years. Following is a chart out of MS Excel which plots an 8 day moving average of NYSE total volume against the NYSE composite. The charts speaks for itself.
(Prices (green line) on right scale, Volume (black line) on left scale)
Saturday, September 25, 2010
Subscribe to:
Post Comments (Atom)


Just woke up from my nap (can't remember if I was dreaming about apples). My brain doesn't "get" the volume chart. Could you explain in greater detail?
ReplyDeleteAl,
ReplyDeleteThis weekend market analysis is one of the best available anywhere IMO.
The preferred and alternate counts are clearly described.
Thanks for that as always.
Bill
thanks
ReplyDeleteIf I get time this coming week I'll get into more depth on the volume issue.
ReplyDelete