ES
Choppy sideways stuff on ES today, wholly in keeping with idea that we are in a Minute W4 with one more push left to complete Minor W5 of the rally dating back to late August.
If this count is correct, then Minor W3 (red) is shorter than Minor W1, so the current Minor W5 cannot exceed the length of Minor W3. Minor W3 traveled 69.00 points, so measuring from the "e" wave low of Minor W4 at 1173.75 the cap on this rally should be 1242.75 (1173.75 + 69.00 = 1242.75). If that level is exceeded without a decent correction then the rally is extending. An extension in the rally could travel a considerable distance.
GOLD
Gold keeps on trucking, if the idea of a flat correction in progress is correct it needs to roll over pretty quick. Realistically it doesn't look like that is going to happen. A reasonable limit for travel on a "b" wave in an irregular flat is 1.382 times the travel of the "a" wave, so that puts a limit around 1416 past which I'd have to say the flat correction alternative is off the table.
EUR
EUR looks like it's completed or is close to completing the 1st wave down of a correction. We thus should see a retrace of the downstroke of the last few days. If that's true, it means potential weakness in the US$ which supports the case for another push up in the ES. It also probably would spur the gold rally past the 1416 level mentioned above.
Monday, November 8, 2010
Sunday, November 7, 2010
Weekend Update 11/6/10 - markets at a crossroads
The election results on Tuesday combined with the FOMC announcements Wednesday really put the ES in retro rocket mode. I've modified my EW count some from the last time I posted it, but the bottom line remains the same: we are in a 5th wave to the rally that started in late August. The market is due a breather, and it ended the week on an overbought note. The question is will it develop into something more serious than a breather.
As you can see, this count has Minor Wave 4 ending with wave "e" of a triangle at Monday PM's low. That's followed by Minute 1 and 2 (green) into the dip following the FOMC news on Wednesday PM, with Minute W 3 in progress (and quite possibly complete) since then. That would leave Minute 4 and 5 waves yet to conclude Minor Wave 5 and also the Intermediate wave that started at the August lows.
The alternative is that the rally extends, that is certainly possible - there is a seasonal up bias at this time of year.
Barring the alternative and assuming the above count is correct, there are two possibilities upon the conclusion of the current Intermediate Wave.
The first is that Jul 6 low marked the conclusion of Primary Wave B of an X wave, with the market currently in Primary Wave C of that move. The rally from late August is Intermediate Wave 3 of a 5 wave structure that started at that Jul 6 low. As such, we should see an Intermediate Wave 4 corrective sequence followed by a final Intermediate 5. Intermediate 4 should carry down to the area of Minor Wave 4, which would be the ES 1170 to 1180 area.
ES Intermediate Alternate 1
The second intermediate term possibility is that the rally from late August is Intermediate Wave C of a 3 wave move from the Jul 6 low. In this view, the Jul 6 low only marked the end of Major Wave A of Primary Wave B. The idea is that Primary Wave B is tracing out a 3 legged flat type of correction, with the B leg close to done and thus the C leg soon to follow. The C leg target at a minimum should reach the A leg low of Jul 6 around ES 1000, with a more likely target somewhere below that level.
ES Intermediate Alternate 2
Of course, if the current Intermediate wave continues it's upward march from here in the form of an extended wave then the flat correction alternative goes out the window.
EUR/US$
I've some Elliott Wave analysis on the EUR. First up is a long term chart for perspective:
The first thing to know about currencies is that they tend to behave more like commodiies than equities from a long term perspective. Equities in the long term move in 5 wave impulses whereas currencies and commodities tend to move in 3 wave cycles.
The second thing to know concerns time cycles. Tony Caldero has done some excellent work on currency cycles http://caldaro.wordpress.com/2010/10/06/the-currency-time-cycle/. He has determined that there appears to be a 17 year cycle in currencies. There is not a long term history on currencies, they've only been floating for 40 years, so if there is a longer cycle it's not readily apparent as of yet.
The last 17 year currency top (vs. the US$) was in 1995, so currencies in general are due for a long term top sometime in the next two years, ideally in 2012. The last bottom was 2002, and the EUR bottomed with all the others. Since that low, the EUR has traced out one Primary A-B-C sequence which topped in 2008, followed by an "X" wave bottom during the crash in the fall of 2008 which ushered in the start of a new Primary A-B-C sequence that is currently in progress. That Primary sequence had an A leg top in in late 2009 followed by a B leg bottom in early June of this year, so that we are currently in the final Primary C wave rally sequence of the pattern.
C waves in corrections are 3rd waves, and as such tend to have some power. This one is turning out to be of that sort, as can be seen in the steepness of the slope since the early June lows.
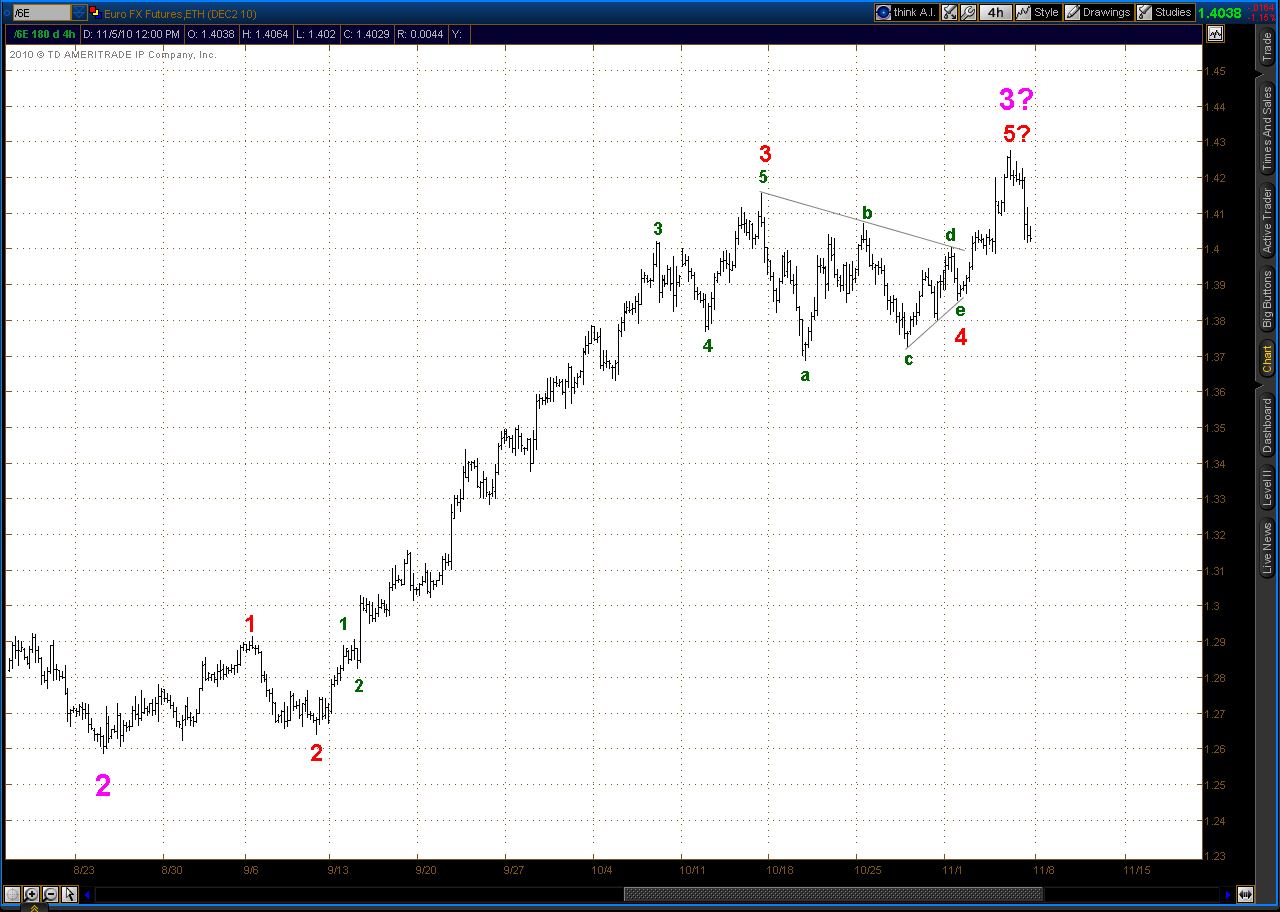
From a shorter term perspective, it looks like the EUR has concluded (or is close to ending) Intermediate Wave 3 of the first wave up from the Primary B bottom. The sideways track from the top of Oct 15 through Monday (Nov 1) of this last week is pretty clearly a triangle W 4. Triangles in this position always precede the last wave of a move, and there are a distinct 5 waves up into Thursday's highs followed by a steep drop off into the close Friday. If this count is correct, we have started an Intermediate W 4 correction which should see lows in the area of the prior 4th wave of one degree lower, which would be the 1.37 to 1.38 area. Finally, Intermediate W2 took the form of a zig-zag, so this W4 should be either another triangle or a flat.
One final word on the EUR : there is a very possible alternate long term count which I will present at a future date.
GOLD
Gold is at a crossroads. There are two alternates here with very different implications.
Alternate 1
Daily Chart
Hourly Chart
In this view, gold finished it's fifth sequence of Wave 1 - 2's of ever decreasing degree with the lows of Oct 22. Doesn't seem likely, but it is possible.
Alternate 2
Daily Chart
Hourly Chart
Alternate 2 has Minute W 3 (green) complete at the highs of Oct 14 and the "a" leg of a flat type correction done as of the lows of Oct 22. The "b" leg of that flat is either done as of Friday's highs or close to done. That should be followed by a "c" leg to complete Minute W 4 with a target low in the 1275 to 1300 area.
Alternate 2 seems the more likely here. Recent news with respect to Gold indicates that fundamental supply/demand pressures that have been bullish in the last year or so are now neutral at best. That means that the primary driver of gold prices at this point is the value of the US$. If the preceding EUR analysis is correct, then it would indicate that the US$ is about to rally which would be bearish for Gold. Incidentally, and probably not coincidentally, a US$ rally also would apply downward pressure to equities and thus the ES.
So we are at a crossroads across the board.
As you can see, this count has Minor Wave 4 ending with wave "e" of a triangle at Monday PM's low. That's followed by Minute 1 and 2 (green) into the dip following the FOMC news on Wednesday PM, with Minute W 3 in progress (and quite possibly complete) since then. That would leave Minute 4 and 5 waves yet to conclude Minor Wave 5 and also the Intermediate wave that started at the August lows.
The alternative is that the rally extends, that is certainly possible - there is a seasonal up bias at this time of year.
Barring the alternative and assuming the above count is correct, there are two possibilities upon the conclusion of the current Intermediate Wave.
The first is that Jul 6 low marked the conclusion of Primary Wave B of an X wave, with the market currently in Primary Wave C of that move. The rally from late August is Intermediate Wave 3 of a 5 wave structure that started at that Jul 6 low. As such, we should see an Intermediate Wave 4 corrective sequence followed by a final Intermediate 5. Intermediate 4 should carry down to the area of Minor Wave 4, which would be the ES 1170 to 1180 area.
ES Intermediate Alternate 1
The second intermediate term possibility is that the rally from late August is Intermediate Wave C of a 3 wave move from the Jul 6 low. In this view, the Jul 6 low only marked the end of Major Wave A of Primary Wave B. The idea is that Primary Wave B is tracing out a 3 legged flat type of correction, with the B leg close to done and thus the C leg soon to follow. The C leg target at a minimum should reach the A leg low of Jul 6 around ES 1000, with a more likely target somewhere below that level.
ES Intermediate Alternate 2
Of course, if the current Intermediate wave continues it's upward march from here in the form of an extended wave then the flat correction alternative goes out the window.
EUR/US$
I've some Elliott Wave analysis on the EUR. First up is a long term chart for perspective:
The second thing to know concerns time cycles. Tony Caldero has done some excellent work on currency cycles http://caldaro.wordpress.com/2010/10/06/the-currency-time-cycle/. He has determined that there appears to be a 17 year cycle in currencies. There is not a long term history on currencies, they've only been floating for 40 years, so if there is a longer cycle it's not readily apparent as of yet.
The last 17 year currency top (vs. the US$) was in 1995, so currencies in general are due for a long term top sometime in the next two years, ideally in 2012. The last bottom was 2002, and the EUR bottomed with all the others. Since that low, the EUR has traced out one Primary A-B-C sequence which topped in 2008, followed by an "X" wave bottom during the crash in the fall of 2008 which ushered in the start of a new Primary A-B-C sequence that is currently in progress. That Primary sequence had an A leg top in in late 2009 followed by a B leg bottom in early June of this year, so that we are currently in the final Primary C wave rally sequence of the pattern.
C waves in corrections are 3rd waves, and as such tend to have some power. This one is turning out to be of that sort, as can be seen in the steepness of the slope since the early June lows.
From a shorter term perspective, it looks like the EUR has concluded (or is close to ending) Intermediate Wave 3 of the first wave up from the Primary B bottom. The sideways track from the top of Oct 15 through Monday (Nov 1) of this last week is pretty clearly a triangle W 4. Triangles in this position always precede the last wave of a move, and there are a distinct 5 waves up into Thursday's highs followed by a steep drop off into the close Friday. If this count is correct, we have started an Intermediate W 4 correction which should see lows in the area of the prior 4th wave of one degree lower, which would be the 1.37 to 1.38 area. Finally, Intermediate W2 took the form of a zig-zag, so this W4 should be either another triangle or a flat.
One final word on the EUR : there is a very possible alternate long term count which I will present at a future date.
GOLD
Gold is at a crossroads. There are two alternates here with very different implications.
Alternate 1
Daily Chart
Hourly Chart
In this view, gold finished it's fifth sequence of Wave 1 - 2's of ever decreasing degree with the lows of Oct 22. Doesn't seem likely, but it is possible.
Alternate 2
Daily Chart
Hourly Chart
Alternate 2 has Minute W 3 (green) complete at the highs of Oct 14 and the "a" leg of a flat type correction done as of the lows of Oct 22. The "b" leg of that flat is either done as of Friday's highs or close to done. That should be followed by a "c" leg to complete Minute W 4 with a target low in the 1275 to 1300 area.
Alternate 2 seems the more likely here. Recent news with respect to Gold indicates that fundamental supply/demand pressures that have been bullish in the last year or so are now neutral at best. That means that the primary driver of gold prices at this point is the value of the US$. If the preceding EUR analysis is correct, then it would indicate that the US$ is about to rally which would be bearish for Gold. Incidentally, and probably not coincidentally, a US$ rally also would apply downward pressure to equities and thus the ES.
So we are at a crossroads across the board.
Friday, November 5, 2010
Friday 11/5/10 update
2:55 PM CST
Looks almost certainly that EUR is going to close below the hourly trendline and generate a sell signal. Am selling long EUR
11:10 AM CST
Hourly Trend/Osc on EUR/US$ flirting with a sell signal, Dynamic Oscillator tracking below 80 and prices closed right at uptrend line at the top of the hour.
Looks almost certainly that EUR is going to close below the hourly trendline and generate a sell signal. Am selling long EUR
11:10 AM CST
Hourly Trend/Osc on EUR/US$ flirting with a sell signal, Dynamic Oscillator tracking below 80 and prices closed right at uptrend line at the top of the hour.
Thursday, November 4, 2010
Thursday 11/4/10 update
Gold is getting me crazy.
There are two possibilities here. First is a continuation of the idea presented yesterday, which is that Minute Wave 3 (green) ended with the highs of Oct 14 - 15 and we are currently in Minute Wave 4. Since Minute 2 was a zig zag, Minute 4 should be either a triangle or flat. With the run up of last night and today the triangle is off the table, so that leaves the possibility of a flat.
Gold Alternate 1
The other possibility is that Minute Wave 3 is extending. In this case the low of Oct 22 would mark the end of a zig zig Micro Wave 2 and we are now in Micro Wave 3.
Gold Alternate 2
The ES has also been quite difficult of late, but I believe the picture is beginning to clarify with today's rally. If the below count is correct, we are in the 3rd of a 3rd of a 3rd of Minor Wave 5 (red). Target right now is in the ES 1220 area.
There are two possibilities here. First is a continuation of the idea presented yesterday, which is that Minute Wave 3 (green) ended with the highs of Oct 14 - 15 and we are currently in Minute Wave 4. Since Minute 2 was a zig zag, Minute 4 should be either a triangle or flat. With the run up of last night and today the triangle is off the table, so that leaves the possibility of a flat.
Gold Alternate 1
The other possibility is that Minute Wave 3 is extending. In this case the low of Oct 22 would mark the end of a zig zig Micro Wave 2 and we are now in Micro Wave 3.
Gold Alternate 2
The ES has also been quite difficult of late, but I believe the picture is beginning to clarify with today's rally. If the below count is correct, we are in the 3rd of a 3rd of a 3rd of Minor Wave 5 (red). Target right now is in the ES 1220 area.
Wednesday, November 3, 2010
Wednesday 11/03/10 update
1:30 PM CST
Updated Elliott count for gold:
The triangle formation projected in this count is only a guess. Minute Wave 2 (green) was a double zig-zag so by the Elliott rule of alternation Minute Wave 4 should be either a flat or triangle.
Long term Elliott count on gold:
When looking at the long term gold chart keep in mind that gold behaves like a commodity. Commodity Elliott patterns vary from equities in their 5th waves which tend to be the most powerful, as opposed to equities where the 3rd wave is generally the strongest. As a result, it's important to note that gold is only partway into a Primary Wave 5 (red roman numeral IV in 2008 marks primary wave low) and thus appears to have quite a long way to go before a long term top.
11:15 AM CST
Sell signal on hourly Trend/Osc for gold:
Gold also is very close to a sell on the daily Trend/Osc. The Dynamic Oscillator is already tracking below 80, if prices close below the uptrend line today it is a sell signal. The daily uptrend line is at 1335.70.
Updated Elliott count for gold:
The triangle formation projected in this count is only a guess. Minute Wave 2 (green) was a double zig-zag so by the Elliott rule of alternation Minute Wave 4 should be either a flat or triangle.
Long term Elliott count on gold:
When looking at the long term gold chart keep in mind that gold behaves like a commodity. Commodity Elliott patterns vary from equities in their 5th waves which tend to be the most powerful, as opposed to equities where the 3rd wave is generally the strongest. As a result, it's important to note that gold is only partway into a Primary Wave 5 (red roman numeral IV in 2008 marks primary wave low) and thus appears to have quite a long way to go before a long term top.
11:15 AM CST
Sell signal on hourly Trend/Osc for gold:
Gold also is very close to a sell on the daily Trend/Osc. The Dynamic Oscillator is already tracking below 80, if prices close below the uptrend line today it is a sell signal. The daily uptrend line is at 1335.70.
Tuesday, November 2, 2010
Tuesday 11/2/10 wrap up
We may have seen (or are close to seeing) a top of some significance on the ES. There is the possibility that the see saw since the lows of last Wednesday is an ending diagonal. The up waves since then have been more easily counted as having three legs, which is how a diagonal is supposed to look.
If this count is correct it represents the conclusion of Minor wave 5 of the rally that started at the end of August. Timing fits as well, as today is election day - "buy the rumor, sell the fact".
The most likely alternate here is one that was presented yesterday which has the ES in a 3rd of a 3rd subwave to Minor wave 5 with more distance yet to travel.
Timing here is just as plausible : a burst if enthusiasm caused by election results, and then the air gets let out of the balloon.
Considering all this I sold 1/2 of the long ES's today and am holding the other 1/2 pending developments.
If this count is correct it represents the conclusion of Minor wave 5 of the rally that started at the end of August. Timing fits as well, as today is election day - "buy the rumor, sell the fact".
The most likely alternate here is one that was presented yesterday which has the ES in a 3rd of a 3rd subwave to Minor wave 5 with more distance yet to travel.
Timing here is just as plausible : a burst if enthusiasm caused by election results, and then the air gets let out of the balloon.
Considering all this I sold 1/2 of the long ES's today and am holding the other 1/2 pending developments.
Monday, November 1, 2010
Monday 11/1/10 wrap up
On the ES, so much for the triangle discussed over the weekend. I should have known, it was too obvious. A couple of alternatives at this point:
Alternate 1
Alternate 2
Alternate 1 has minor wave 4 (red) forming a flat with the "c" leg of that flat in progress. The problem with that is minor wave 2 was also a flat, so the Elliott rule of alternation is violated.
Alternate 2 has minor wave 4 complete at last Wednesday's lows, with two wave 1 -2 sequences occuring since then. Minor wave 4 is a zig-zag in this count, which satisfies the rule of alternation. But minute wave 1 (green) is apparently 3 waves and should be 5, so that's a problem. It is possible that we're seeing the start of an ending diagonal for minor wave 5, which would allow for a 3 wave move as wave 1.
Thus I am not very confident in either alternate.
Meanwhile still holding long ES. It looked like there would be a sell signal on the ES hourly Trend/Osc today during the last hour of regular trading when the ES dropped below it's uptrend line - the Dynamic Oscillator had already broken below 80. But the rally into the close moved it back over that line so no sell signal was issued.
Alternate 1
Alternate 2
Alternate 1 has minor wave 4 (red) forming a flat with the "c" leg of that flat in progress. The problem with that is minor wave 2 was also a flat, so the Elliott rule of alternation is violated.
Alternate 2 has minor wave 4 complete at last Wednesday's lows, with two wave 1 -2 sequences occuring since then. Minor wave 4 is a zig-zag in this count, which satisfies the rule of alternation. But minute wave 1 (green) is apparently 3 waves and should be 5, so that's a problem. It is possible that we're seeing the start of an ending diagonal for minor wave 5, which would allow for a 3 wave move as wave 1.
Thus I am not very confident in either alternate.
Meanwhile still holding long ES. It looked like there would be a sell signal on the ES hourly Trend/Osc today during the last hour of regular trading when the ES dropped below it's uptrend line - the Dynamic Oscillator had already broken below 80. But the rally into the close moved it back over that line so no sell signal was issued.
Subscribe to:
Posts (Atom)