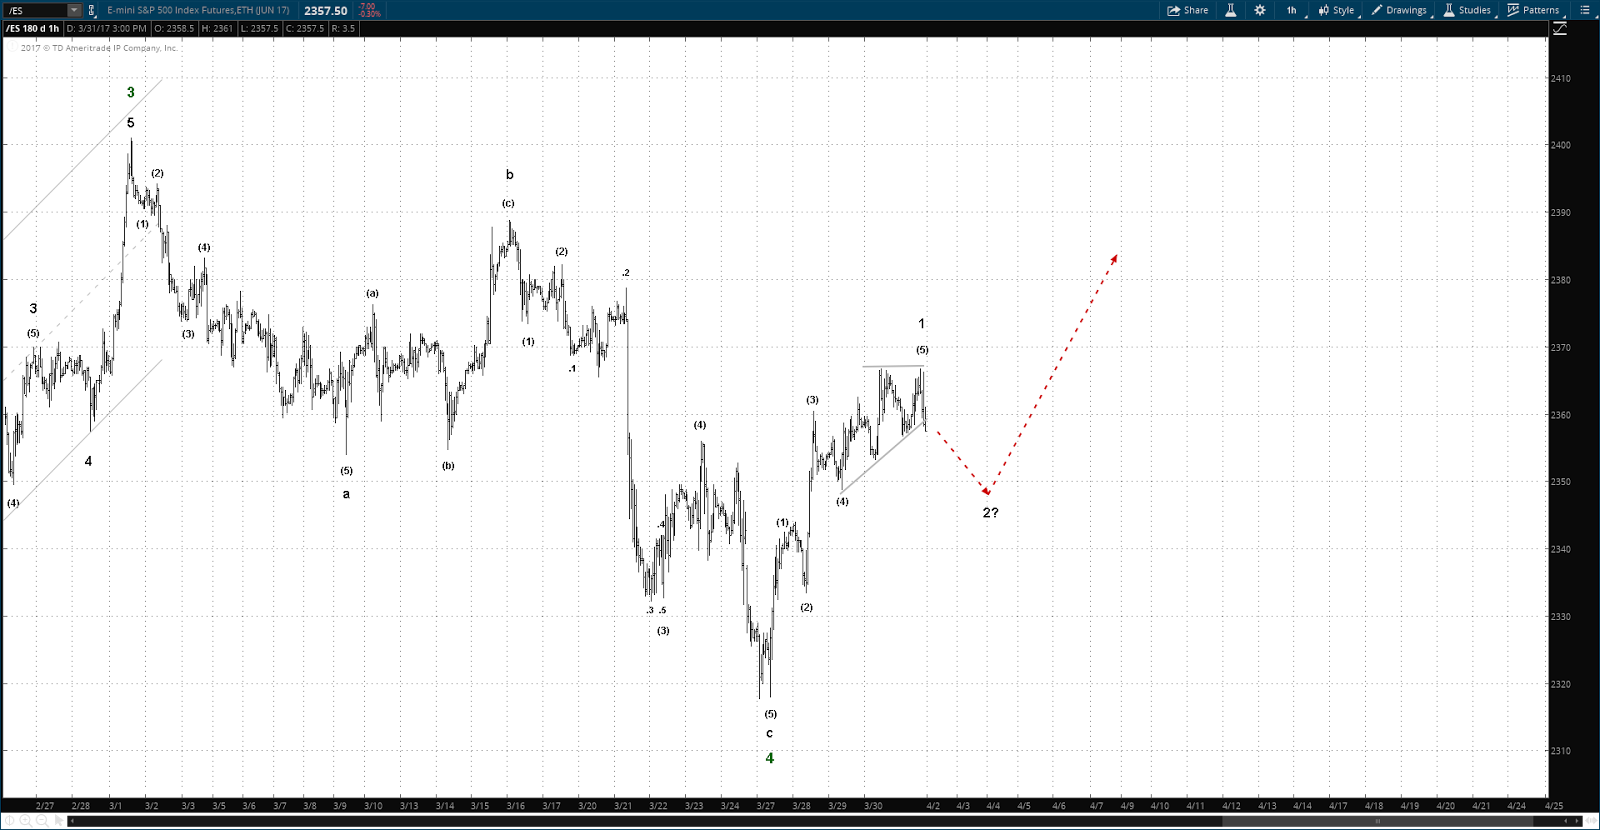
On Tuesday this week the ES/SPX appeared to roll over into the meltdown that has been anticipated in recent posts with a strong and impulsive selloff that bottomed on Thursday. However, the BTFD crowd stepped in early Thursday morning and generated an equally strong and impulsive round of buying. Typical. Markets always have a way of sowing doubt.
The late week rally to this point is only three waves, and my short term momentum indicators reached "overbought" conditions late Friday. So the pre-conditions for a resumption of the sell off are in place. But the problem with momentum indicators is that the market can and does keep right on chugging regardless of what those indicators are suggesting. If they are accurate then a resumption of the selling should occur early next week and that will validate the short term counts. If not and the rally continues to new all time highs then those short term counts will have to be reworked.
However, from an Intermediate Term standpoint the action since the March 1st highs still looks very much like a market top under construction. So barring a sustained rally to new highs significantly above those recently attained the longer term view remains bearish.
The IT Elliott counts remain as have been presented in recent weeks, with two possibilities still open:
NOTE: dotted lines show potential EW structures and are not necessarily accurate price/time forecasts
Saturday, May 20, 2017
Sunday, May 14, 2017
Sunday, 5/14/17 update
The ES/SPX hasn't given us a whole lot of new information in the last couple of weeks. From an Elliott Wave perspective the pattern has been difficult to decipher, lot's of choppy and range bound action. However there are two related observations that can be made at this juncture:
1) The seasonal tendency in recent years has been for bear market conditions over the summer ("sell in May and go away");
2) Equity indexes tend to build rounded tops, and that's what the last couple of months look like.
The two possibilities of recent note are still on the table. The 1st alternate in the chart below has a Minor W3 top as of March 1st with the a flat type W4 correction in progress since then, and in that flat waves "a" and "b" are done and wave "c" is just starting - this would indicate a sustained bear market in the coming weeks.
The 2nd alternate has Minor W3 still in progress but very close to topping. This would allow for one more stab up past ES 2400, possibly topping around ES 2412, before rolling over into a sustained bear trend.
Either way it appears that a summer bear market is in the offing.
NOTE: dotted lines show potential EW structures and are not necessarily accurate price/time forecasts
1) The seasonal tendency in recent years has been for bear market conditions over the summer ("sell in May and go away");
2) Equity indexes tend to build rounded tops, and that's what the last couple of months look like.
The two possibilities of recent note are still on the table. The 1st alternate in the chart below has a Minor W3 top as of March 1st with the a flat type W4 correction in progress since then, and in that flat waves "a" and "b" are done and wave "c" is just starting - this would indicate a sustained bear market in the coming weeks.
The 2nd alternate has Minor W3 still in progress but very close to topping. This would allow for one more stab up past ES 2400, possibly topping around ES 2412, before rolling over into a sustained bear trend.
Either way it appears that a summer bear market is in the offing.
NOTE: dotted lines show potential EW structures and are not necessarily accurate price/time forecasts
Sunday, April 30, 2017
Sunday, 4/30/17 update
We're back to where we were several weeks ago in the ES/SPX with two possibilities apparent. Those are that Minor W3 off the election day low ended at the Mar 1st high as in the 1st chart below or that Minor W3 is still in progress with Minute W5 of that move underway as in the 2nd chart below. Under the 1st option the market should turn south in the area of the Mar 1st high (2401 in the ES), under the 2nd the market should blow past those highs.
NOTE: dotted lines show potential EW structures and are not necessarily accurate price/time forecasts
Saturday, April 22, 2017
Saturday, 4/22/17 update
The sideways grind continues in the ES/SPX but indications are that we're close to the end. The pattern since the Mar 1st high looks very wedgy, the ST chart below reflects that in the form of a triangle. There are other possibilities of course, but this seems the most likely IMO. But I've been wrong before. Sometimes this type of pattern resolves with a final steep plunge before wrapping up, so caution is warranted.
Intermediate term chart:
Saturday, April 15, 2017
Saturday, 4/15/17 update
It's now fairly certain that Minor W3 topped on Mar 1st. With that in mind here's a current IT chart:
The ES is in a 4th wave. 4th waves are notoriously complex and frustrating. A couple of possibilities for the structure of the move are outlined in the below ST chart, but a lot of other things could happen as well.
Sunday, April 9, 2017
Sunday, 4/9/17 update
Last week's action in the ES muddied up the short term picture somewhat. Of the two alternates being followed in recent weeks the idea that Minor W3 off the election day low is still in progress has been the preferred count. The alternate is that Minor W3 was complete at the Mar 1st high. That preferred count remains the most likely, but it's probability vs. the alternate has now dropped very close to 50/50, mainly due to the amount of time the market is spending churning sideways. We really need to see a sustained rally to new all time highs relatively soon to keep the preferred count healthy. As far as invalidation levels, the preferred count is eliminated if the selling accelerates and the ES drops below The Minute W1 high of 2277.00 registered on Jan 6. Unfortunately that's a distance away so it may be of no immediate help in deciphering where we're at. This is especially so if the ES continues to churn sideways, which it could well do. The alternate is eliminated if we rally up from here to new all time highs as mentioned earlier.
One final note, and sorry if this is getting confusing: a case could also be made for the possibility of Intermediate W3 being complete at the Mar 1st high. The significance of this is that a very major market top is much closer than would be anticipated in the above alternates.
NOTE: dotted lines show potential EW structures and are not necessarily accurate price/time forecasts
Preferred count
Alternate count
One final note, and sorry if this is getting confusing: a case could also be made for the possibility of Intermediate W3 being complete at the Mar 1st high. The significance of this is that a very major market top is much closer than would be anticipated in the above alternates.
NOTE: dotted lines show potential EW structures and are not necessarily accurate price/time forecasts
Saturday, April 1, 2017
Saturday, 4/1/17 update
The preferred count for the ES/SPX has the market in a Minor W3 rally that commenced on the election day lows of last November. As of last weekend's update Minute W1, W2 and W3 were complete with Minute W4 in progress. Minute W4 appears to have bottomed at last Monday's low, so the presumption is that Minute W5 is underway. ST count under that scenario looks like this:
Longer term perspective:
As indicated on the chart a 1st target level for Minute W5 and thus Minor W3 is ES 2412.00. It needs to be noted that Elliott Wave rules are that the 3rd wave in an impulse cannot be the shortest wave. In the current count for Minor W3 off the election day low Minute W3 is shorter than Minute W1. Thus Minute W5 cannot be longer than Minute W3 for the count to be valid. The invalidation price level that is indicated is ES 2470.25 if in fact Minute W4 was complete at last Monday's low. If that level is exceeded during the anticipated rally then the most likely inference is that Minor W3 is extending (subdividing) in some fashion.
Finally it also needs to be noted that the alternate count presented last weekend is still in play.
NOTE: dotted lines show potential EW structures and are not necessarily accurate price/time forecasts
Longer term perspective:
As indicated on the chart a 1st target level for Minute W5 and thus Minor W3 is ES 2412.00. It needs to be noted that Elliott Wave rules are that the 3rd wave in an impulse cannot be the shortest wave. In the current count for Minor W3 off the election day low Minute W3 is shorter than Minute W1. Thus Minute W5 cannot be longer than Minute W3 for the count to be valid. The invalidation price level that is indicated is ES 2470.25 if in fact Minute W4 was complete at last Monday's low. If that level is exceeded during the anticipated rally then the most likely inference is that Minor W3 is extending (subdividing) in some fashion.
Finally it also needs to be noted that the alternate count presented last weekend is still in play.
NOTE: dotted lines show potential EW structures and are not necessarily accurate price/time forecasts
Subscribe to:
Posts (Atom)