Not a lot has changed since the update of last Saturday. The market continued to move sideways during the week with a push up to the ES 1990 area where it was rejected a couple of weeks ago and where it was rejected once again on Wednesday. Thursday and Friday were a sideways drift that has the look of a base for another bullish push.
The EW count in the above chart is only one of a number of possibilities. It is not necessarily the most likely except in the sense that it portrays a market relieving a severely "oversold" situation but not a market in the initial stages of an extended bull move - i.e. the market is taking a breather before continuing the bear trend that commenced last Spring.
There is proof that there is more to come from the bear. The Equity Oscillator - Daily (see the post of last Monday) is a tool developed in the mid '80's and tracked by the author since that time. The original version of the EOD has a periodicity of 7-10-10 days and generates peaks and troughs relatively quickly on a daily basis. When the 7-10-10 EOD registers a significant low it typically shoots up off that low as the maxed out legs of the indicator quickly move into positive territory. If the market has truly seen a significant price low then the upwards acceleration of the 7-10-10 EOD is accompanied by a sustained and rapid appreciation in price. So in those situations the EOD is signalling the kick-off to a new bull market. However, there are times when the thrust up by the EOD is not accompanied by an equivalent thrust in prices. Almost without fail those instances are a sign of a bear market rally that eventually rolls over.
To illustrate, take a look at the 7-10-10 EOD charted against the NYA in 2009 (sorry, this chart is out of Excel, my trading platform does not have all the necessary stats to construct the EOD earlier than 2013):

On the left side of the chart note how the EOD (blue line at bottom of chart) shoots up off an oversold level near a reading of .50 in early March, 2009 and quickly peaks above 2.50 a week or so later. Meanwhile prices also shoot up off that low but continue to run higher in the following months with very little hesitation.
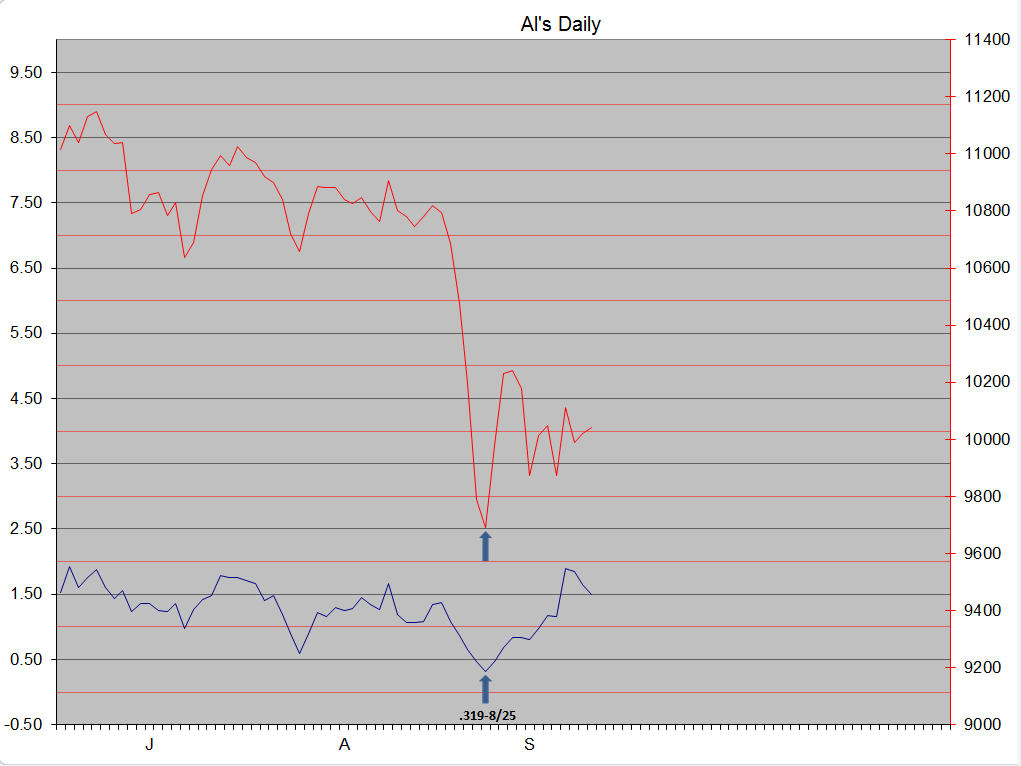
Now look at the same data for recent months: