Last week the bullish EW count had a very awkward looking 5 wave pattern topping with the high on Dec 12. The action since then has clarified things - the move up from the Nov 16 low into last Wednesday's high now looks to be a leading diagonal 1st wave. The drop off from there into Thursday evening's mini-crash low was either Minute Wave 2 or Micro wave "a" of Minute Wave 2.
Bull alternate

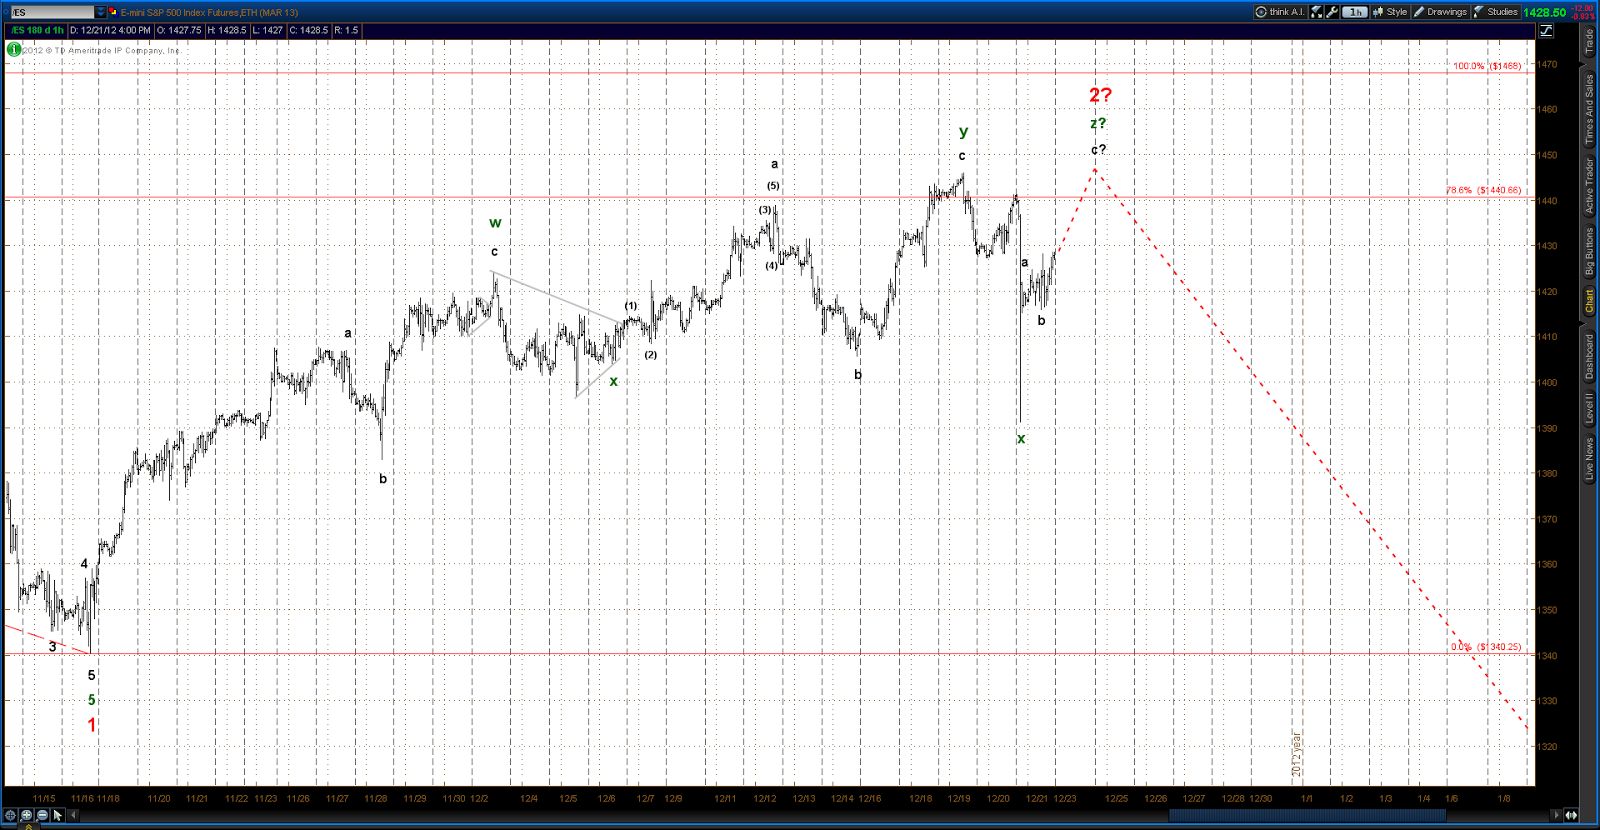
The bear alternate has a double zig-zag Minor Wave 2 complete at last week's high. The sell-off into Thursday's low could be either the start of Minor Wave 3 down or an "X" wave preceding the 3rd and final zig-zag for Minor W2. The severity of Thursday's mini-crash certainly fits what can be expected in a 3rd wave.
Bear alternate

OR
One thing of note on the very short term is the recent behavior of the Vindicator Buy/Sell. This is a proprietary indicator that measures equity market buying and selling pressure using Advance/Decline and volume statistics. The notable behavior in this index is the failure of the Buy line to cross below the Sell line during the sell-off of last Wednesday through Friday - this is normally what happens when the market rolls over. This suggests that there is a higher likelihood of rising prices over the very short term.

