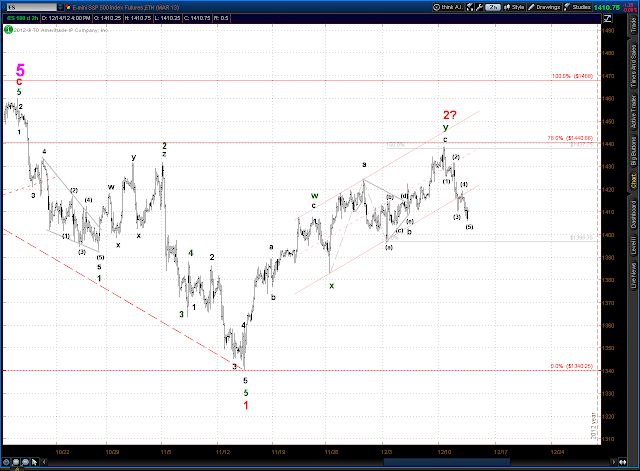
1) The pattern from the Nov 16 low at 1340.25 into this last week's top at 1438.75 was pretty choppy. Although a 5 wave count can be deciphered in the pattern it is not clearly impulsive - you have to really work to tease one out of the chart. If it is in fact an impulse then the intermediate term should be bullish on balance. The other interpretation of the pattern is that of a double zig-zag, which is a corrective sequence that portends a bear market in progress on the intermediate term (and maybe longer).
2) The selling from the Dec 12 top has been impulsive with a clear 5 waves down apparent. Although a bottom of some sort is quite likely at Friday's low, any rally here should be short and quick and should be followed by more selling. How far that further selling will go depends on whether the bull alternate or the bear alternate is the correct point of view.
Bear Alternate
Hourly chart
Daily chart
Bull Alternate
Hourly chart
Daily chart


