The bull alternate is still alive and well even with Friday's late plunge. In fact both the bull and bear counts have arrived at the cusp of a potentially explosive move at exactly the same time, which fits nicely with the fiscal cliff background. However, from an EW point of view the pattern up from the mid-November low into the Dec 19 high is pretty choppy - much more typical of a corrective wave than an impulse - and this would throw the odds to the bear case.
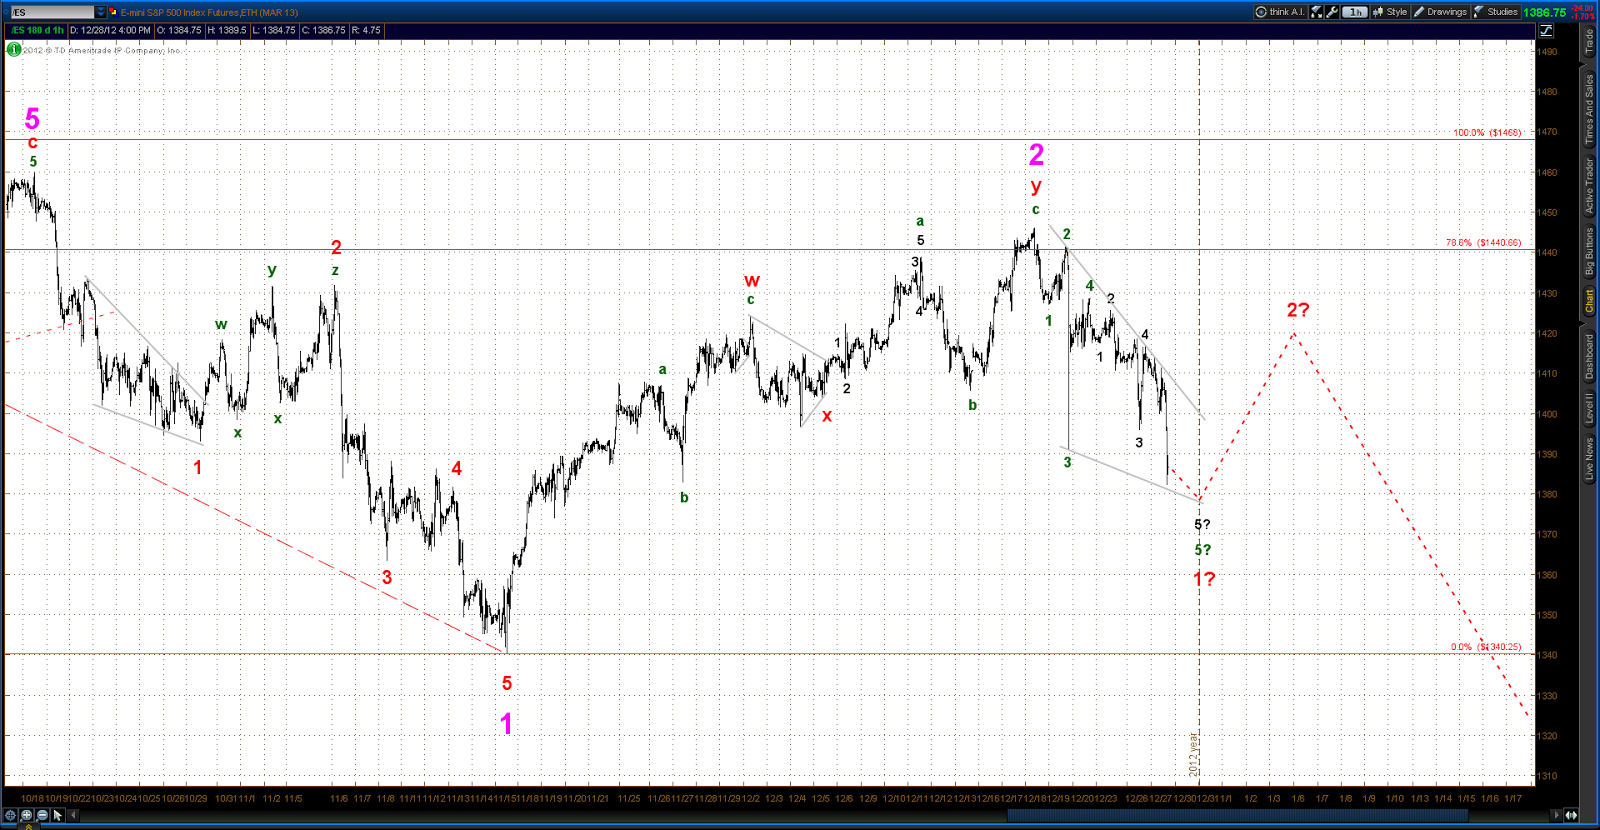
The bull alternate has the ES close to completing an irregular flat 2nd wave, which should lead to a strong and sustained 3rd wave move up.
Bull alternate

There are two ways to view the current bear alternate. The 1st is as a series of waves 1 & 2 of declining degree since the top of Dec 19, in which case the market is right on the edge of a 3rd of a 3rd wave collapse. The 2nd is not as immediately bearish. It has the pattern from the Dec 19 top classified as an almost complete leading diagonal, in which case a wave 2 bounce in the very near future is dictated.
Bear alternate

OR