Epic bull/bear battle last week, but the bears were decidedly victorious, inflicting considerable technical damage in the process. The top for the three year bull market dating back to Oct 2011 is confirmed as in place. Current EW count is that the Sep 19 highs are the top for Primary Wave III of the long term uptrend dating back to the Mar '09 lows. Primary Wave II was a flat, and the C wave of that structure lasted 5 months and took around 25% off the ES/SPX. Primary Wave IV is now in progress and should alternate with a zig-zag or triangle. It should roughly equate to Primary W II in price damage and duration.
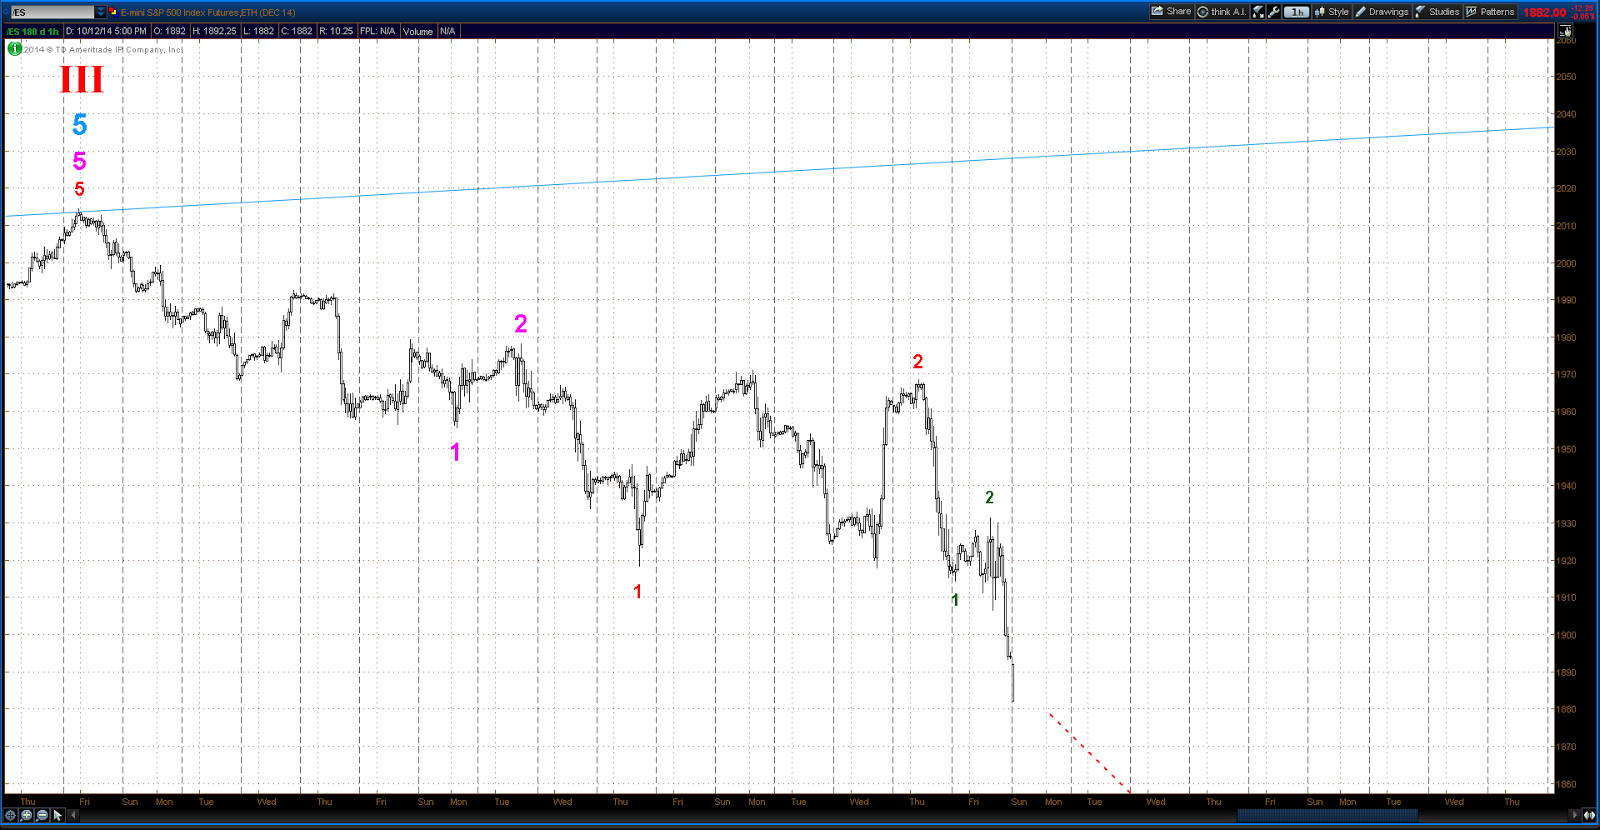
The short term picture shows a quite choppy pattern since the Sep 19 ATH. The best count is that of a series of nested 1st & 2nd waves as below, but this will quite probably have to be revised as the move matures.
One final note. The fact is that there are only 3 completed waves up off the Mar '09 lows. Thus the possibility that the whole run from those lows is in fact a corrective wave still remains open. This would portend a crash more severe than that of 2007 - 2009. Odds of this being the case have to be regarded as low at this point, but it is possible.