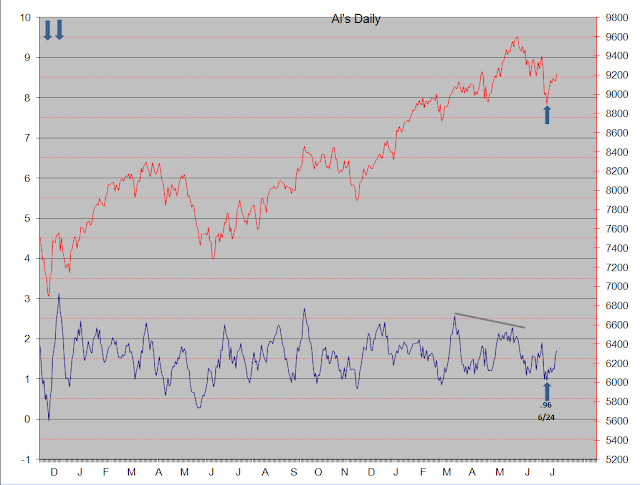
I stared and stared at my charts Thursday night trying to determine exactly what that formation is, and never reached a fully satisfying conclusion. Is it a flat? Possibly. Except the C leg isn't a clear 5. Is it a triangle? Definitely not. Is it a zig-zag? Possibly a triple zig-zag, but it's not very clean. So maybe it's something entirely new. I decided to name it a "WTF". Stands for "Wiggle Thy Finger" or "Whip The Fool" or something like that (this is a G rated site) - you get the idea.
Just kidding.
Turns out that the buy signal of Jun 25 on Al's Indicator may be a very good one after all. I viewed it with a fair amount of skepticism at the time. But since then the moves up have been impulsive and moves down have been corrective. So it looks like the IT correction from the May 22 top ended at the Jun 24 lows. If so, the current count on both the bullish and bearish alternates puts the ES/SPX in a 5th wave with a target in the low 1700's at a minimum.
It should be noted that the rally from the Jun 24 lows may be an "X' wave preceding a third and final zig-zag into new lows for Minor W4, but this possibility seems unlikely. It will definitely be ruled out if the ES trades above the Jun 19 "X" wave high of 1649.00.


WTF!! hahaha...that's a good one! best of luck Apple
ReplyDeleteHi Al,
ReplyDeleteI have been checking in on your wave counts and they are as always very well presented. I see you from time to time on Pretzel's site and one of your last ones was like an epiphany to me. I have been trying to come up with a way to invest in ES and have some confidence. I have actually gotten lucky a few times but I want to learn. Would you be willing to share your trades with me? I state hear and forever after that I know that anything you state or note is NOT TRADING ADVICE, its just that I need someone to share ideas with or better stated learn from.
I have learned from pretzel and others but they all have different approaches and strategies. I want to learn how to trade ES. I particularly do not want to make trades every day. Anyway, please let me know what you think.
I'm not interested in sharing my trades, I used to do that (on this site as a matter of fact) and I found that publishing my trades adversely affected my trading - the thought of having others follow me into a trade got me overly cautious. Result: lost money.
ReplyDeleteYou're right, everyone has their own trading style. I also don't want to trade every day - i.e. I'm not a day trader but rather a position trader. However, even in that context I need to monitor the market continuously, sometimes very closely sometimes not. My approach is to identify the underlying intermediate term trend and trade with the trend - establish the trade (hopefully) early in the trend and hold it until it looks like the trend is changing. Usually that means jumping in and out at times, but always in the direction of the underlying trend. BTW the "Market Trends" column on the right on this site identifies what my analysis system says is the current trend, both from a short term ("Hourly") basis and intermediate term ("Daily") basis.
One final note: the essential decision is pretty simple on its face: is the market going to go up, down or sideways. Obviously much more complex when you actually get into it. But it's important to understand that markets can spend a lot of time just thrashing around in a trading range (i.e. sideways) - and those are the periods when a trader can get really chewed up. So however you design your approach you must allow for the trading range type market in some manner.