It's been said that market bottoms are made but tops are formed. That jumps out on the ES daily chart of the last year. The lows of Oct '11 and this past June are made and the market immediately jumps up and away. But the triple top of mid-September through mid-October looks like a kid on a trampoline. Was a pain in the neck to trade as well.
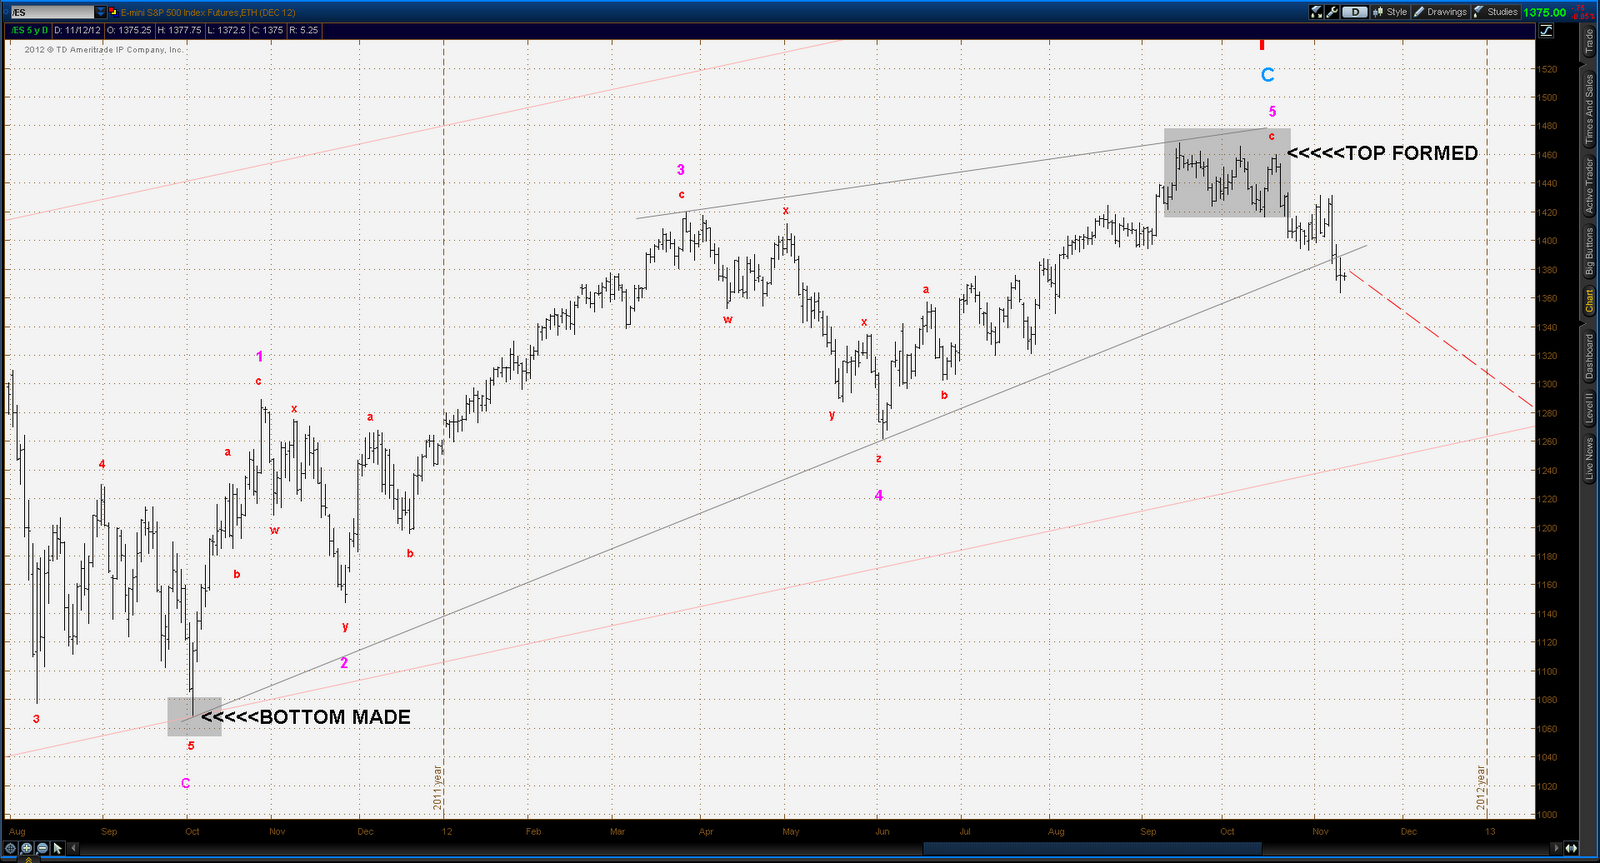
Of course the big question is whether we've seen THE top of the bull run dating back to the crash lows of Mar '09. That certainly is one of the possibilities here, but the bull case is not yet completely dead. When will it be? Hard to answer that question. What can be said is that there are levels which if breached would significantly diminish the odds of a continuation of the bull market. The 1st of those would be the June low at 1262.
Daily EW counts of the bull and bear alternates currently look like this:
Bull alternate

Bear alternate

Zooming in to the very short term and assuming the bear alternate, the drop that started at the Oct 18 highs is either a Minute Wave 1 & 2 followed by a Micro Wave 1 with Micro W2 in progress or it's Minute Waves 1 through 3 with Minute W4 in progress. Either way more selling should materialize in the very near future.

