Underlying technicals over the last week have a bearish cast to them:
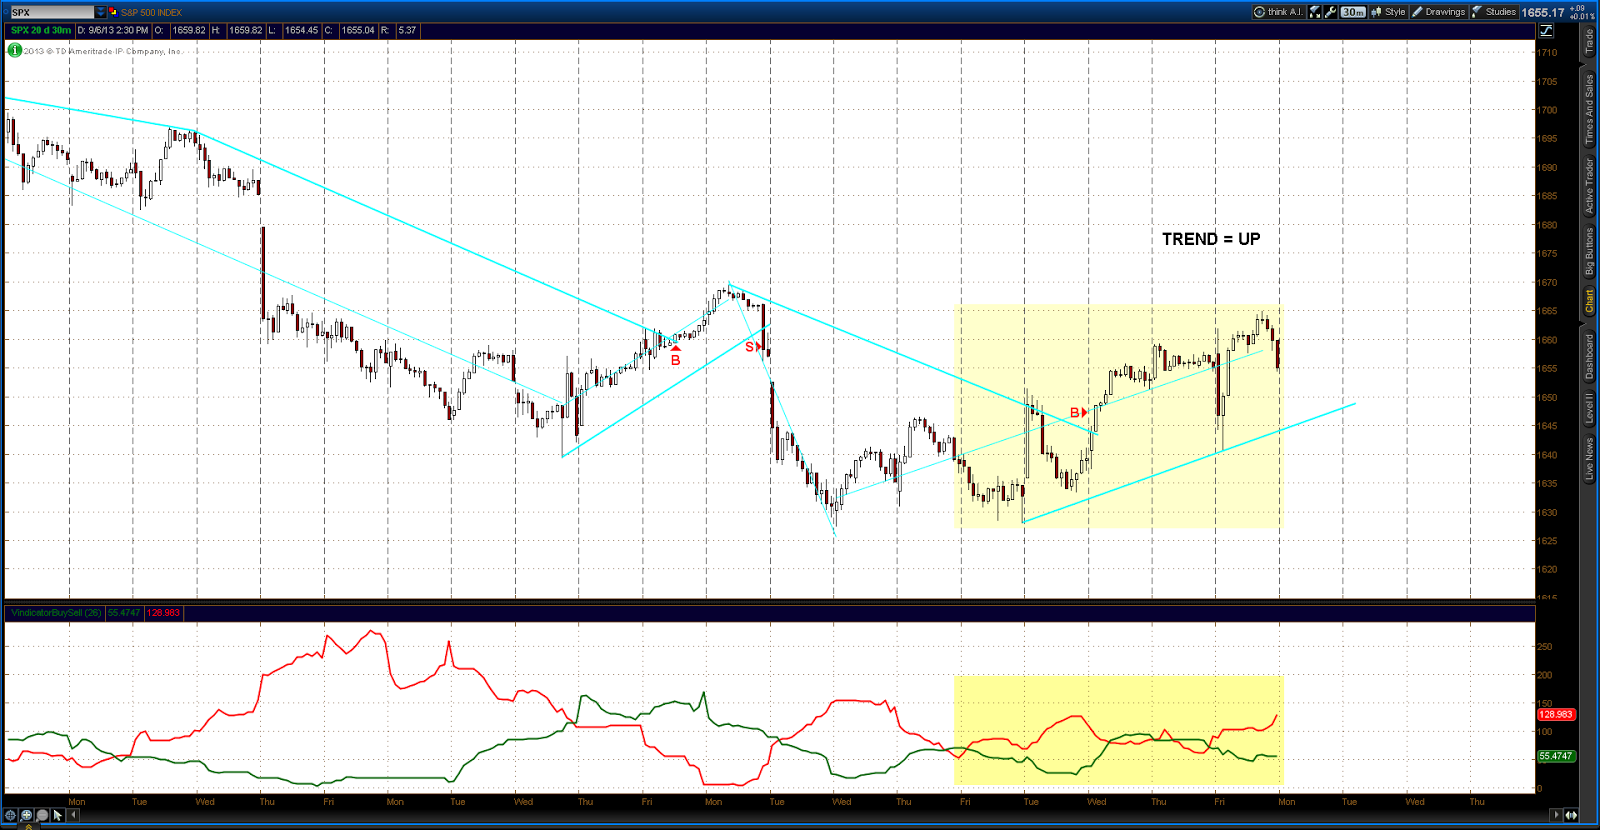
Above is a 30 minute chart of the SPX against the Vindicator Buy/Sell index, a proprietary indicator which measures buying and selling pressure in the NYSE. Of note is the behavior of the index over the last week : selling pressure (red line) pretty much outpaces buying pressure (green line) even though prices have worked their way upwards. This is not the pattern that is usually observed at the kickoff to a bullish sequence. Normally bull market kickoffs generate a pattern that would be expected where buying pressure accelerates while selling pressure drops off. So this is definitely a bearish sign.
So assuming that the bear market has more in store, the current EW count looks like this:

There are a number of possible counts for the pattern since the Intermediate W3 high of Aug 5, the above count is the most probable of those. This count has a Minor Wave "a" low at 1631.50 on Aug 21 with Minor Wave "b" in progress since that time. Minor Wave "b" is forming a 3-3-5 flat type correction with the Minute Waves "a" and "b" of that structure complete and Wave "c" commencing at the 1625.50 low of Aug 30. Minute Wave "c" is forming an ending diagonal with waves 1 through 4 of that ED in place. It is possible that wave 5 completed at Friday afternoons high print of 1664.00, which would conclude Minute Wave "c" and thus Minor Wave "b". If not, then a possible target is at the .50 retrace of Minor Wave "a" at 1668.25.
The conclusion of Minor Wave "b" will mark the onset of Minor Wave "c". This would be the 3rd wave of the sequence off the Aug 5 top, and thus should exhibit some strength.
