The preferred EW count for ES/SPX is intermediate term bullish, and that appears to be playing out. Current count has a Minute W1 done at ES 1375.00 on Jul 5 followed by a zig zag Minute W2 low at 1319.75 last Thursday Jul 12. The ES/SPX should now be in Minute W3 and as such should develop into a relatively strong rally. The patterns since last Thursday's low are very impulsive looking. A five wave sequence was complete overnight on Monday-Tuesday followed by a very sharp and short correction during regular hours Tuesday morning which in turn was followed by more impulsive looking rally sequences. This looks and feels like the beginnings of a sustained rally, and very much fits into what can be expected out of a 3rd wave.

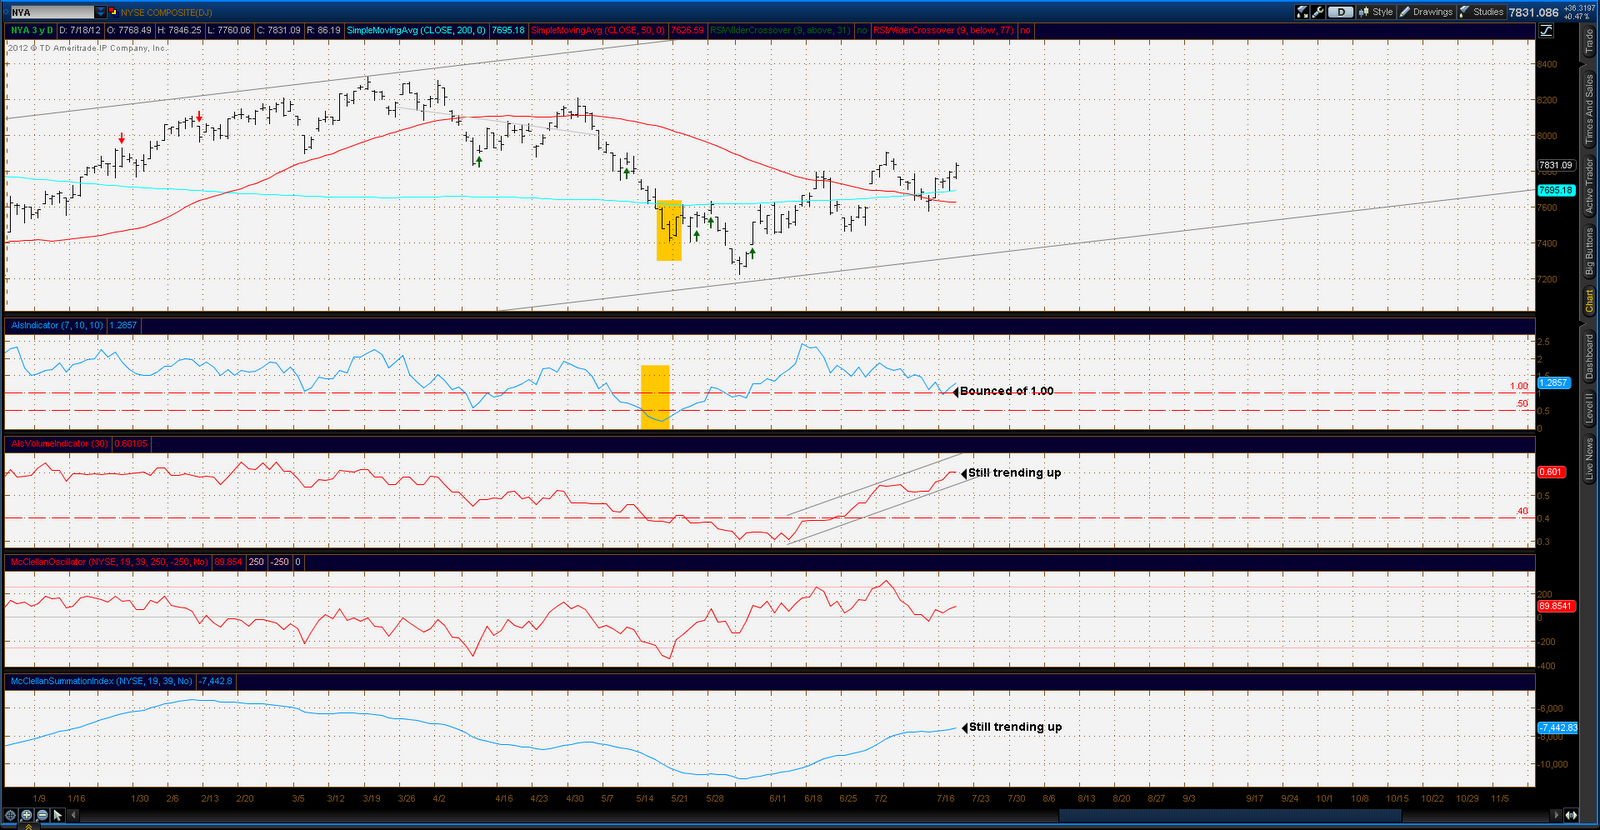
Underlying technicals, although positive, are not overly impressive in terms of total market volumes and daily A/D statistics. But the longer term bullish count has the ES/SPX in a 5th wave, so "knock off your socks" technicals are not to be expected. As mentioned, they are positive: Al's Indicator bounced off the 1.00 line early this week and is now uptrending, the 30 day positive/total volume indicator is continuing to uptrend, the McClellan oscillator is rising off a neutral reading, and the McClellan Summation Index is also continuing to uptrend.
Personal note: On the road for business the rest of the week, will try to update daily charts when possible