CURRENT CHARTS


Click HERE to view current charts


Sunday, May 24, 2015

Sunday, 5/24/15 update

Holiday weekend, just charts

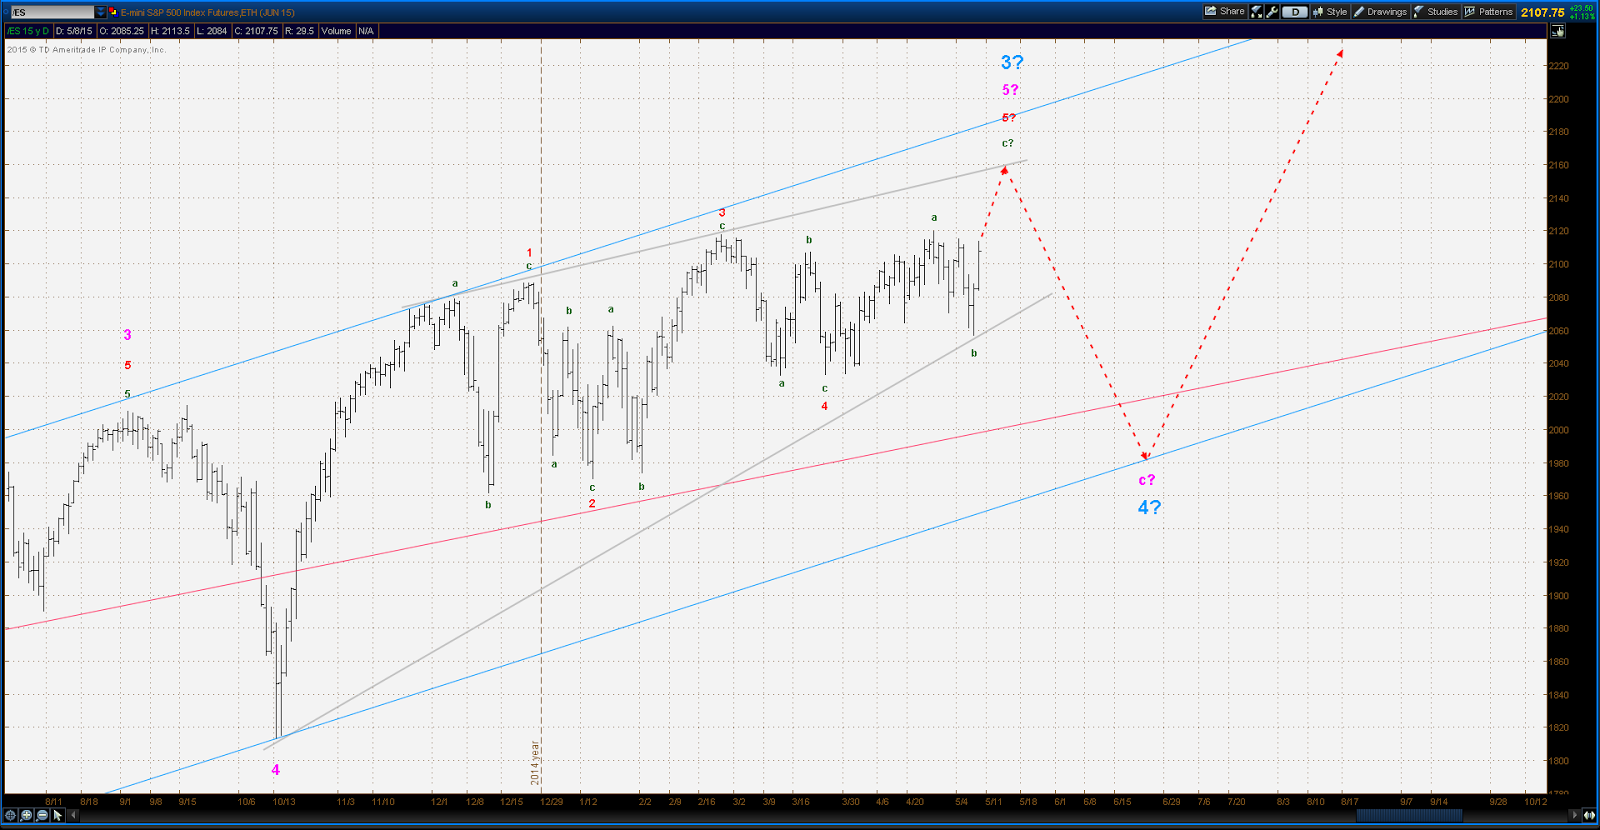
Daily bars

Hourly bars

Saturday, May 16, 2015

Saturday, 5/16/15 update

New highs this week and maybe, just maybe, we've broken out of this interminable trading range.  Both alternate EW counts would dictate more rally action, but the ending diagonal alternate is more limited in that respect.  The ending diagonal fits the character of this market better, for that reason it has better odds of being the correct count.

Updated counts:

Alternate #1

Alternate #2

Sunday, May 10, 2015

Sunday, 5/10/15 update

I have to confess that the strength of Friday's rally took me completely by surprise.  My intraday indicators were signalling a short term bottom on Thursday morning:


However, I was convinced that the bull had been slaughtered and that we were about to see sausage being made, so I didn't take a long position on the indicated turn but rather planned on shorting this puppy with both fists whenever it looked like the rally was losing steam.  At this point that plan is, as they say, "inoperative".  The only consolation is that I didn't go short on Thursday (not that I wasn't tempted).

So the ES/SPX is still range bound and approaching the upper end of that range.  Given the strength shown on Friday it's a fair bet that new ATH's will be seen this coming week.  Whether we will see sustained trade north of the upper boundary of the recent range is an open question, and the answer to that question turns on which of the two alternate EW counts presented in the last month are correct.  Although Friday's rally forced a minor revision of those counts they remain essentially the same:

Alternate 1: Major W5 of Primary W III in progress, Intermediate Waves 1 & 2 of Major W5 done, currently Inter W3 in progress:

Alternate 2: Major W3 of Primary W III still unwinding with Intermediate W5 of Major W3 forming an ending diagonal, Minor Waves 1 through 4 of Intermediate W5 done and Minor W5 in progress:

Saturday, May 2, 2015

Saturday, 5/2/15 update

Last week started out with a nice impulsive looking sell-off which held the promise of a decent bear trend.  However, by Wednesday it became obvious that not a whole lot had changed with respect to market activity in recent months - i.e. lots of overlapping, choppy moves without evidence of strong conviction from either bulls or bears.  Translation: still in a trading range.

The best count apparent in the ES for the weeks action is that of a double zig-zag into a low on Thursday PM which marked a short term change in trend:


So where do things stand as far as the two alternates on deck from last weeks update?  On the near term bullish alternate, the count would be a couple of waves 1 & 2 nests with a wave 3 commencing at Thursday's low:

Daily chart:

The more bearish alternate has a significant top in place at Monday morning's high with the corrective pattern for the week labeled as an "A" wave of a developing flat, triangle or some sort of complex corrective sequence.  The chart below projects a flat.


The correction in this alternate would be Major W4 of the bull market off the October, 2011 low:


 As can be seen, Major W2 (blue) was a zig-zag, so the EW rule of alternation suggests other types of corrective sequences as mentioned earlier.  Also, Major W2 lasted about a month which would suggest a similar duration for Major W4.

Saturday, April 25, 2015

Saturday, 4/25/15 update

Although the ES did not make a new ATH this week the cash market (S&P500) did as well as a number of other indexes.  So one of the three alternates under consideration in recent weeks can reasonably be eliminated, and that is that the  highs of Feb 25 marked the start of a bear market.  That leaves two alternates:


 The 1st alternate has Major W5 of the bull market from the 2011 lows underway, with Inter W1 & W2 of that structure complete and W3 in progress.  That leaves waves 4 & 5 yet to unwind into a significant Primary W III top.  Possible targets for that top are at 2147.75 where Major W5 = .786 x Major W1, and at 2195.00 where Major W5 = Major W1.


The 2nd alternate has Major W3 of Primary W III still unfolding but in its final stages with an ending diagonal Intermediate W5 in its final stages.  Target here should be in the vicinity of the trendline connecting Minor W1 & W3 of the diagonal, currently it looks like 2155 - 2160 is a likely area.  If this alternate is in play then the bull market off the 2011 lows has a bit yet to run in terms of time and price - it will need a Major W4 & W5 to play out yet before the Primary W III top.  Unfortunately for the bear camp, from an EW standpoint this alternate fits better with the waves that have been formed, both from a daily and from an intraday standpoint.

Saturday, April 18, 2015

Saturday, 4/18/15 update

Nice sell off on Friday, but bears shouldn't get too excited yet.  We are still inside the trading range of recent months, with ES 2118 marking the upper boundary and 2032 the lower.  Until one of those two levels is surpassed with sustained trade the intermediate term trend is indefinite.  My guess is we'll see a stab above the upper limit for a week or two, just enough to suck in more bulls, and then we'll top.

The 3 alternate possibilities presented in recent weeks are STILL in play.  Rather than walk through them again, here are the charts:

                                                                       Alternates 1 & 2

                                                                           Alternate 3

The NYSE Tick analysis did a great job of signalling Friday's selloff on Thursday.  Note that the indicator declined steadily on Thursday despite the rally earlier in the day, i.e. it diverged.  This chart has been getting posted twice a day here.


Saturday, April 11, 2015

Saturday, 4/11/15 update

The equities market has sure been doing a good job of hiding it's longer term intentions as of recent months, which is to say that the intermediate term trend has been sideways.  Nice market for swing traders, impossible market for those who like to play trends or who might be perma-bulls or perma-bears.  OK for day trading for those who are nimble. 
One would like to think that a change in the long term trend from bull to bear is in the works, we've seen 6 years of steady and sometimes powerful up moves.  There is no doubt that the upside momentum that was apparent in recent years has been absent.  But a bear move cannot yet be said to be underway with any conviction.

The three possibilities presented a couple of weeks ago are still in play.  The 1st two are that the top of Feb 25 marked the termination of Primary Wave III off the Oct 2011 lows or that it marked the top of Intermediate Wave 1 of Major Wave 5 of Primary Wave III:


The 3rd possibility is that Intermediate Wave 5 of Major Wave 3 is still in progress and is forming an ending diagonal:


----------------------------------------------------------------------------------------------------------------------------

There are a couple of short term indicators that I've been experimenting with that show some promise:


The 1st indicator (blue line) is an adaptation of Al's Daily Indicator to intraday use.  The 2nd indicator (red line) is an oscillator based on the NYSE tick.  So far my take on these is that they are pretty reliable in a cycling market but tend to become useless in a strongly trending market.  These indicators will be posted on this site here.  I will post them at least once a day as well as intraday as time permits.  If anyone is interested in the code for these indicators please contact me at sunset@mwt.net.