CURRENT CHARTS


Click HERE to view current charts


Monday, May 31, 2010

Long Term Possibilities (update)

In early May three possible longer term scenarios were presented, actually on HOB - meant to publish that post at this site as well but never got it done. Anyway, they were the P3 scenario (bearish), the new bull market scenario, and the X wave scenario (intermediate term bullish, longer term bearish).
Daneric does a great job outlining the P3 count (http://danericselliottwaves.blogspot.com/). His P3 count looks like this:

P3 scenario is that a major (decades or even centuries) long term top was made in 2007 and the Mar 2009 lows were only the end of wave 1 of a just as major corrective sequence with wave 2 in progress or terminating.  Wave 3 ("P3"), a mega crash, is thus in the offing.  Under this scenario, the action since early May can be characterized as a series of 1 - 2's and looks like this:

There are no major objections to the P3 scenario from an Elliott standpoint that I can see.  I do question it for several reasons. First, it is an election year and the Ben & Tim  show will be doing their best to keep the boys on the Hill happy. Second, the P3 scenario is a financial collapse scenario, and the signs of a credit market collapse are not evident at this point, despite EURO difficulties.  Two ways to monitor this are the TED spread, which is the difference in interest rates between T-bills and the overnight interbank borrowing rate as represented by LIBOR, and also LIBOR itself.  As credit market risks increase and liquidity decreases these benchmarks will increase.  As you can see, although there has been a recent uptick in these two, they are no where near the levels seen in 2008 - 2009.
Finally consideration needs to be given to the ability of the market to discount the probabilities of future circumstances, real or imagined.  The fact is that the fortunes and influence of the current folks in power in Washington are on the wane, and investors are bound to see that as a plus for equity values down the road.  So the more those folks stub there toes, the more the investing public is likely to view equities as an opportunity.


One last thing needs to be pointed out for all you P3 fans.  The fact is that except for a very minuscule portion of the world represented by traders and blog-o-sphere types (and maybe some Middle Eastern fanatics), the vast majority of folks don't want a financial collapse and, of course, will do everything in their power to prevent it.  That's not to say that some entirely unpredictable Black Swan event, such as an alien invasion or something, can't come along and slam us, it just means that the nature of things mitigates against a collapse happening.

The new bull market scenario is one held by Tony Caldaro (http://caldaroew.spaces.live.com/)  amongst others.  It sees the top in 2007 as the end of a decades long wave 1, with the lows in 2009 as the end of wave 2.  His count looks like this:

From an Elliott standpoint there is difficulty labeling the bull market from Mar '09 to the high last month as a 5 wave impulse for two reasons: waves 2 and 4 are both zig zags and thus do not alternate structure as Elliott requires, and the structure of wave 3 can be counted as a 5 wave impulse only with great difficulty.
Here's what this count looks like so far this year:
As you can see, this scenario currently requires another C wave down at minimum to complete the current corrective sequence.
In addition to the problems with this count from an Elliott standpoint, there is another point of contention.  Although the credit markets are not currently showing signs of any great difficulty, it's hard to imagine that the amount of US national debt outstanding and the rate of continuing increase of that debt are not going to be a major problem down the road.  Thus the thought that we are embarking on a major cycle Wave III is difficult to accept.  

Finally there is the X wave scenario. That count puts a major cycle wave top at the highs of 2000 and sees the pattern from there into the 2009 lows as a flat correction.  Since then the markets are in the process of putting in an A-B-C ""X" wave which will eventually end in the vicinity of the 2000 and 2007 highs.  The A leg of X is complete and the markets are currently working through or have completed the B leg. 

The count so far this year looks like this:

As you can see this count shows the B leg complete at last Tuesday's lows.   There is a problem with this count from an Elliott standpoint, and that is that waves 2 and 4 (purple) of C of B do not alternate in form, they are both zig zags, although W4 is complex while W2 is simple.
However, there is reason to believe that last Tuesday marked a significant low based on some daily technical charts I've been keeping for some years (since 1987 in some cases).
First is a study that sums CBOE index call volume over a 20 and 100 day period and compares them in the form of a ratio (20 day sum/100 day sum).  I know this sounds weird, but bear with me.  It turns out that the ratio is a great "bottom finder".  It meanders around most of the time, but in a bear market it will spike as the market approaches it's bottom.  Here's what that looks like (graph is out of Excel, sorry):

Next is a volume study that generates a ratio of NYSE positive volume to total volume over a 30 day period, positive volume is defined as the volume on any day the NYSE has an up close. Note the current extreme oversold condition on this indicator.


Last is a study that's a blend of several momentum type statistics, let's call it Al's Daily.  Note the similarity in indicator pattern of Mar'09 to that of the last month.

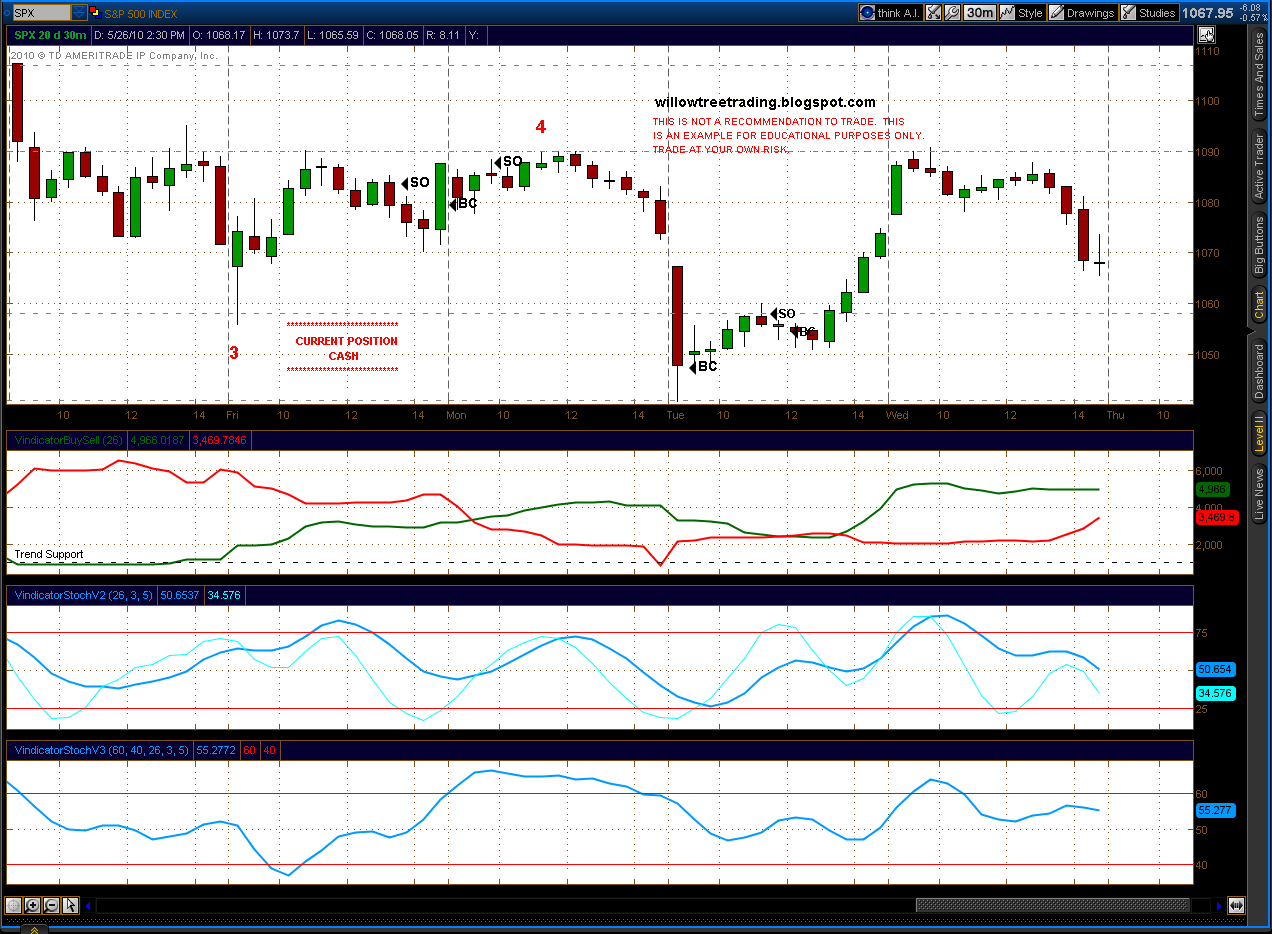
Given the contrasting bullish or bearish viewpoints, here's how price action can be labeled since last Tuesday's lows (these are ES rather than SPX since I trade ES):

BULL

BEAR


-Apple Al

Friday, May 28, 2010

Friday 5/28/10 wrap up

Got the bottoming action on the 30 minute V Stoch that I've been looking for late today so went long ES.  However, same problem here as a few weeks ago with opening a trade on Friday going into the weekend and the potential for bad news out of Europe, compounded this time by being a U.S. 3 day holiday weekend.  Also compounded by a mid-afternoon announcement of a downgrade of Spain's debt rating.  Did the same thing here as last time, hedged the position with puts rather than a stop loss for fear of gap down open on Sunday night.  BTW, the ES is trading starting Sunday @ 5 PM thru Monday @ 10:30 AM (CST) and then re-opening Monday @ 5 PM.
  I'm planning to post an update of the long term possibilities presented a few weeks ago, hope to have time for that tomorrow.

Thursday, May 27, 2010

Thursday 5/27/10 wrap up

FRUSTRATION.  Turned bullish two days ago and have been waiting for the 30 minute V Stochs to bottom at or near buy territory for a low risk entry and just isn't happening.  Also tried to short ES on a day trade today when 30 minute V Stochs rolled over but got stopped out for a 6 point loss.  Meanwhile prices melting up after lunch for the balance of the day.  I'm going to consider going long off a bottoming of the V Stoch on the 5 minute chart, it's possible this thing could just keep rolling for a while.

Wednesday, May 26, 2010

Wednesday 5/26/10 wrap up

The more I look at current charts and some daily indicators I follow, the more I think that yesterday morning's lows were a significant turning point.  The selling into the close and after hours today is testing that thinking, although as I write this (5:45 PM CST) the ES seems to have stabilized.  Currently in cash, no trades since mid-day yesterday.  Been watching the 30 minute V Stochs as they trend downwards, currently I'm thinking long ES when the Stochs bottom and turn up depending on other conditions at that time.  It would help if the Buy line would stay above the Sell line on the Buy/Sell Vindicator.

Looks like 5 waves up from yesterday's lows, and an a-b-c zigzag down into the low of a little while ago.  That low was right in the .618 retracement vicinity, market needs to stay roughly in this area or better overnight or the current wave count is in jeopardy.  If we keep selling to a point below yesterday morning's low then the wave count will need serious rework.  

Tuesday, May 25, 2010

Tuesday 5/25/10 wrap up

Closed the ES short trades from yesterday during the first 1/2 hour this morning when the ES broke above the down channel it had formed on the 5 minute chart. The ES low targeted in my post last night was 1034.25, we bottomed at 1036.75, close enough in my book.  Tried a day trade short ES around mid-day based on the 5 minute V Stoch rolling over, closed it for a (very) minor profit after about 30 minutes when the 5 minute V Stoch  bottomed out with no major break in the market.  On the sidelines for the rest of the day.
Five waves down from the 5/13 highs can be counted as complete at this morning's lows  The action later today has been quite strong and impulsive which confirms the end of a major down move this morning.  From an EW standpoint the alternates at this point are numerous, so there is no "larger picture" count yet, more time is needed to weed out the possibilities.  If I get time I may lay those alternates out this coming w/e.

Update 5/25/10

Covered short ES day trade
 Short ES @ 1054.75 day trade

Covered short ES in cash

Monday, May 24, 2010

Monday 5/24/10 wrap up

My apologies to those of you who follow the Vindicator @ HOB, that site has a new look and a new host and the settings necessary to access the Vindicator got lost in the transition.  The problem has been identified and access should be available tomorrow.
Looks like the high today in the SPX/ES marked the end of a wave 4(red) with wave 5(red) now in progress.
The strong and impulsive looking sell off into and after the close confirm this labeling.  Wave 1(red) traveled ES 54.50 points, so if W4 did in fact terminate at today's high of 1088.75 then W1 (red) = W5 (red) at 1034.25.
I mentioned last week that I was working on the Stochastic version of the Vindicator.  It's performance during the sell off last week was odd to say the least.  I rechecked the code and the input data last Thursday evening and found no issues.  Over the weekend I experimented with some other ways to manipulate the input data, below is what looks most promising.  The middle indicator below (labeled VindicatorStochV2) is actually the original V Stoch with an enhancement.  The darker blue is that original V Stoch, the light blue is the slope of the V Stoch curve.  I had to do some fancy math dancing to convert the slope into a form that matches the 0 to 100 stochastic format, in actuality the raw number actually oscillates from a negative reading through zero to a positive reading and then back (anybody recognize that from another site?).  Anyway, the idea is to get kind of an early warning on a change of trend.  If you examine the result, it's not 100% but it isn't bad.  The bottom indicator (labeled VindicatorStochV3) uses the same input data as the original V Stoch but handles it just a little bit differently, you can see it pretty much mirrors the original V Stoch but seems to be just a tad more accurate.

As I said both the V Stoch versions tended to mirror each other except for the chart from Friday.  On that day the original V Stoch peaked around lunchtime and then declined through the rest of the day, while the newer version bottomed in the morning and increased during the rest of the day, i.e. they directly contradicted each other.  Interesting.  That problem cleared up today when they both put in peaks and started to decline, the newer V Stoch around mid-morning and the original version around mid-day.  I established short ES when the new version peaked and added to the position when the original one peaked.  So far that's looking good. 

I haven't had time to run an in depth trading simulation with these new twists, I'll try to find time in the near future.  Meanwhile, both versions will now be part of the 30 minute charts available at the Vindicator HOB link.

Friday, May 21, 2010

Friday 5/21/10 wrap up

Spent a couple hours checking the coding for the V Stoch last night.  Also studied the input data to make sure there was nothing out of line there.  Couldn't find any difficulties in the coding or in the raw data.
The reason I was looking is the behavior of the 30 minute V Stoch this week.  Since the excellent sell signal it gave Tuesday morning it kind of meandered around (with an upward bias) into this morning, all the while prices were collapsing   Certainly seemed odd.  The V Stoch has never been observed in a bear market until the last few weeks (it was developed in late January), so "normal" behavior is not well known.
Anyway, 30 minute V Stoch finally went into overbought territory today and subsequently rolled over, I put on a short trade which I held until 20 minutes before the close, covered right at the start of the strong rally that ended the day (timing was luck more than anything).  Closed the position for fear of weekend hi jinks, I will possibly re-enter at the open Sunday.  Note that the Buy line is trending up and the Sell line down,  we are certainly due a bounce but need to be mindful of the possibility that we could be transitioning back to a bull market.
 From an EW standpoint, we clearly have two five wave structures down from the highs of Thursday, 5/13, separated by a 3 wave correction.  I've labeled them 1-2-3 with 4 in progress, but we were quite oversold coming into today and due a bounce of some sort, if the bounce turns into a significant rally then the move is only 3 waves and corrective rather than impulsive.  That would mean the bear market was another short term affair and the bull market is resuming. 

Thursday, May 20, 2010

Thursday 5/20/10 wrap up

Looks like it's door #1.  Doing some work on the Vindicator programming, more later.
 

Wednesday, May 19, 2010

Wednesday 5/19/10 wrap up

Still treading water, in cash.  V Stoch approached an overbought reading today and a consequent sell signal but rolled over before getting there.  That's actually a relief, I believe the odds of the next move being a rally are pretty high, but signals are signals and if we had a sell I would have taken it.  Interesting to note that the SPX/ES and the Euro have been in lockstep, but today the Euro broke to the upside and the SPX/ES didn't really follow.  At least not yet.
If the Buy line drops down below "trend support" and ticks up it'll be a buy signal, especially if accompanied by the V Stoch approaching oversold and curling up.
On Elliott count, not a lot of new information today.  Here's Door #1 & #2:
DOOR #2

DOOR #1

Tuesday, May 18, 2010

Tuesday 5/18/10 wrap up addendum

In addition to the thoughts in the prior post, here's a chart that adds to the bullish argument. It's actually out of an Excel spreadsheet and is based on NYSE data that I've been keeping for quite some years.  The green line is daily NYSE closes, and the blue is the study.  The study is 30 days NYSE up volume/total volume, if the NYSE closes up on any given day the total volume for the day gets counted as up volume, and total volume is just that for the 30 day period.  As you can see, we are currently at extreme oversold levels on on this study, and you'll note that these levels have always led to a bounce at the very minimum. 

Tuesday 5/18/10 wrap up

Today was an object lesson in the weakness with the Vindicator as well as with Elliott wave.
I'll start with the Vindicator.  The question is which Vindicator should one trade off: the Buy/Sell line or the V Stoch?  The Buy/Sell line gave two consecutive buy signals in the last few days when it bottomed below 1000 and ticked up, 1st was at the close Friday and 2nd mid-afternoon yesterday.  However, the 30 minute V Stoch rolled over from a reading above75 this morning which is a sell on that Vindicator version.  Looking at the chart and with 20/20 hindsight it's obvious that a reversal from long to short was dictated when the V Stoch rolled over this AM, especially since prices broke the up trendline off yesterday's lows. So perhaps the weakness is in my read and not the instrument.
For tomorrow I will stay in cash until something definitive develops, right now that looks like another long position if the Buy line drops below 1000 accompanied by the V Stoch bottoming. 
 On Elliott wave, it's weakness is that there are always alternate (and contradictory) counts.  With today's action, door #1 from last week is in play, i.e. continued downtrend to new lows from the highs of a few weeks ago.  As for last night's wave count, it has to be modified somewhat to accommodate today's action.  So here they are:
DOOR #2 (BULL MARKET)

DOOR #1 (BEAR MARKET)

Sold Puts

Stopped out of longs

11:15 am Added to long ES @ 1132.75

Sold Puts, stop loss on ES @ 1128.00

Monday, May 17, 2010

Monday 5/17/10 wrap up

Five waves down can be counted from last Thursday's highs at the lows we had overnight last night, I'm labeling that as a wave "a" with the up-down since then as a "b" and "c" in a zig zag.  Going out on a limb, my guess is that we've seen the end of a 2nd wave correction to a wave 1 which topped last Thursday and we should rally strongly from here.  The Vindicator supports that argument.

The Buy line in the Buy/Sell Vindicator ticked up Friday at the close thereby issuing a buy signal, today it ticked back down this morning and then back up again about mid afternoon generating a second buy signal.  By the end of the day the Buy line was clearly accelerating up and the Sell line curling down as well as prices breaking up out of the channel from last Thursday's highs, all of which confirms the long position and the suggested Elliott count above.  Also note the bullish divergence on the 30 minute V Stoch.
 

Friday, May 14, 2010

Friday 5/14/10 wrap up

Sharp ride down today, but by the end of the day the Buy line ticked up from a decline towards zero (happened at the very end of day).  Also, the 30 minute V Stoch bottomed around mid morning and then started a bullish divergence against prices for the rest of the day.  5 minute V Stoch also showed bullish divergences.  If anything the market is due a bounce after a strong move down like today's, plus we've had a pattern for a few months of "ramp up Monday".  Went long ES about 15 minutes before the close but hedged the position with ES June 1125 Puts.  I really dislike hedging with options, but the situation in Europe is a real wild card and all the technical analysis in the world may be useless in the face of major events that could transpire over the weekend.  It's entirely possible to see a major gap down on the open Sunday PM that opens below any stop loss that might be in place, so options are a choice that gives the downside protection normally provided by a stop loss and avoids the risk of a gap opening below a stop loss. 


On the Ellliott count it looks like door #2 at the moment, i.e. 5 waves up complete at Thursday's highs to end a wave 1, with today's selling being part or all of a wave 2 correction.  Pretty bearish statistics for today's action, on the NYSE decliners over advancers by 7:1 and down volume over up volume by almost 23:1, so that combined with international news makes this interpretation kind of dubious.  We'll know the answer eventually of course, meanwhile it sure is interesting.


5/14/10

Long ES @ 1127.75, hedged with June 1125 Puts at 2:1 ratio

Thursday, May 13, 2010

Thursday 5/13/10

Surprise visitors in town today, so this is a quickie.  Two possibilities:

5/13/10

COVERED SHORT ES

SHORT ES @ 1169.25

Wednesday, May 12, 2010

Wednesday 5/12/10 wrap up

Steady and very orderly ramp up today, extremely bullish feel to it.  The Sell line bottomed today and will give a sell signal when it ticks up from its lows.  That trade should probably be taken but cautiously, with todays rally the bear case is in considerable jeopardy.
Elliott wave count is open to question here as well with today's action.  The rally today could be counted as a 5th wave to the whole rally from last Thursday, in which case we've completed or are close to completing the first wave 1 in another longer term sustained bull move, and the sell-off that ended last Thursday was it for a while.  One thing notable in today's pattern is the hesitation in that same ES 1169 area.  Alternate bullish count follows the next chart.

I did a write up at HOB a couple weeks ago  http://hotoptionbabe.com/2010/05/06/some-long-term-possibilities/ which laid out three alternate long term ideas, the last of which was that the rally up from the Mar '09 lows will be an "X" wave separating two major bear markets.  An X wave is part of a corrective sequence, so it should move in 3 wave patterns.  The next chart is a possible wave count for what we've had so far since Mar '09, and proposes that the sell off that ended last Thursday was the C leg of a running flat correction.  If that is true, then we have in fact embarked on another multi month rally path.

5/12/10

2:00 PM CST STOPPED OUT IN CASH

Moved stop to 1170.00

Tuesday, May 11, 2010

Toesday 5/11/10 wrap up

Leading off with the Elliott wave count to lay out the background for today's trades.  In yesterday's update it was noted that the action yesterday typified a 4th wave with a 5th wave in progress at the close.  The 4th wave part of the analysis was correct, but the 5th wave had actually not yet commenced as of yesterday, rather it started after a gap down open this morning.  Prices then moved steadily up through the day until peaking almost exactly at the spot where the market started its collapse last week.   It also happens to be the price where the 4th wave of that sell off terminated, which is classic Elliott.  If the drop of 4/26 through last Thursday is indeed a 1st wave, then the activity of the rally since then fits Elliott parameters to a tee.    

So coming into today, it appeared that we were terminating the rally up from last Friday's lows at the very least, and quite possibly from the crash lows of last Thursday.  As you can see below, the Buy line moved solidly above the Sell line at the opening this morning, but a decision was made to trade the short side of the equation given the Elliott count.  Thus two short trades were executed today, both geared off the V Stochs.  The first one was this morning when the 5 minute V Stoch rolled over, that trade was stopped out at a loss at the high of the day.  Frustrating.  Hindsight is 20-20, and looking at the Elliott chart above it's now obvious that the stop should have been set a little higher.

The second trade was made when the 30 minute V Stoch rolled over this afternoon. That trade was short at ES 1154.00 and is still open.  After hours market is dropping steadily and is at 1145.00 as I write this, so the short ES's are looking good.

Monday, May 10, 2010

Monday 5/10/10 wrap up

Stopped out of Friday's short ES at open last night, loss of -15.25 points.  Could have been a lot worse but for the stop loss the position was carrying.  The Buy line barely ticked above the Sell line at the close today, we will need some selling tomorrow or we will move into Buy mode. 
Did a quick short trade this morning based on the 5 minute V Stoch, it also was a loser but minor (1 point).
Even though we may move into Buy mode on the Buy/Sell line a short day trade might be something to consider early tomorrow, it looks like today's action was mostly a 4th wave with a 5th wave into the close, so if that's correct then a move down is in order.  A lot will depend on what things look like when we get there.


After some study I'm fairly certain that the move down from 4/26 into last Thursdays lows was 5 waves.  This would indicate that the current rally is a correction and the primary trend is down.  Whether this is the famous P3 or something else remains to be seen.  I did a post on the longer term possibilities on HOB last week which discusses those possibilities http://hotoptionbabe.com/2010/05/06/some-long-term-possibilities/

5/10/10 AM update

COVERED SHORT ES

MOVE STOP TO 1158.75

STOP LOSS @ 1163.00

SHORT ES @ 1153.50  DAY TRADE

Stopped out of Friday's short ES @ open last night @ 1125.25, loss of -15.25.  This is why I trade with SL's, could be looking a LOT worse this morning.  Still in Sell mode on Buy/Sell, might do a short day trade today.

Friday, May 7, 2010

Friday 5/7/10 wrap up

Pretty dull today after yesterday.  Looks like we're tracing out an a-b-c-d-e triangle off of yesterdays lows, it can be seen better on the 5 minute chart.  Sell line solidly above Buy, 30 minute V Stoch trended steadily up today and peaked over a reading of 75, at which point we have a sell signal, so went short ES@ 1110.00 around 2 PM CST.

Did a day trade today off the 5 minute V Stoch, short ES @ 1126.00 around 8:45 AM CST with V Stoch rolling over from peak above 80,  covered @ ES 1110.75 around 10:00 AM when V Stoch curled up from a reading under 20.  Nifty little profit of 15.25 points ($762.50/contract) in 75 minutes.  I like it. 
You can see the triangle formation off yesterday's lows pretty clearly in this chart, waves A, B and C are complete, the open question is whether we've seen D and E or are wrapping up D with E to come.  Either way we're not far from what should come next, which would be a 5th wave down.