This thing looks ripe for a correction:
But the run up from the mid-October lows could well be just Intermediate W1 of Major W5 rather than the entirety of Major W5, so a short duration correction may be all that occurs. Seasonally their is a bullish bias in the coming months, especially in December.
Saturday, November 15, 2014
Saturday, November 8, 2014
Saturday, 11/8/14 update
The ES/SPX has moved up impressively since the mid-October low. Any number of technical measurements are showing an "overbought" situation, including Al's Daily indicator as can be seen below. This rendering has the formula based off a 20 day time frame, as can be seen it's been a respectable identifier of market tops over the last couple of years (note that the price chart is the NYSE).
The EW pattern of the current rally was fairly straightforward through Oct 31st, but the last week of action has gotten a little muddy. Thus there are a number of ways to label the short term count, below are the two most likely alternatives:
There are a couple of things to note in these charts. First, there are enough waves to count a close to complete or actually completed structure off the mid-October low. Second, it's apparent that the rally has lost some steam over the last week - the rate of ascent is visibly weaker. Of course, the market could just be basing for further sharp rally, but the odds are that a correction of some sort is more likely in the very near future.
From a longer term perspective the market is at a critical inflection point.
Major W1 (see legend on right) of the bull market that started in October, 2011 was a fast and furious run up that lasted 18 days and climbed 221 points. Major W5 since the recent mid-October lows has climbed 220.50 points in 17 trading days through Friday. Major W5 = Major W1 at ES 2034.25. Friday's high of 2033.50 is almost a direct hit of that target. So if Major W5 is going to duplicate Major W1 then the top to Primary W III is very close if not already achieved. However, Major W5 could very well extend, and thus a top here could well be only the high for Intermediate W1 of Major W5. That would mean a lot more bull market yet to occur in the coming months.
The EW pattern of the current rally was fairly straightforward through Oct 31st, but the last week of action has gotten a little muddy. Thus there are a number of ways to label the short term count, below are the two most likely alternatives:
OR
There are a couple of things to note in these charts. First, there are enough waves to count a close to complete or actually completed structure off the mid-October low. Second, it's apparent that the rally has lost some steam over the last week - the rate of ascent is visibly weaker. Of course, the market could just be basing for further sharp rally, but the odds are that a correction of some sort is more likely in the very near future.
From a longer term perspective the market is at a critical inflection point.
Major W1 (see legend on right) of the bull market that started in October, 2011 was a fast and furious run up that lasted 18 days and climbed 221 points. Major W5 since the recent mid-October lows has climbed 220.50 points in 17 trading days through Friday. Major W5 = Major W1 at ES 2034.25. Friday's high of 2033.50 is almost a direct hit of that target. So if Major W5 is going to duplicate Major W1 then the top to Primary W III is very close if not already achieved. However, Major W5 could very well extend, and thus a top here could well be only the high for Intermediate W1 of Major W5. That would mean a lot more bull market yet to occur in the coming months.
Saturday, November 1, 2014
Saturday, 11/1/14 update
If this count is correct then the ES is in the 5th wave (Major W5) of the bull market that started Oct 2011. Major W1 was a fast and furious run up that lasted 18 days and climbed 221 points. Major W5 has climbed 204 points in 12 trading days through Friday. Major W5 = Major W1 at ES 2034.25, only 17.50 points up from Friday's high. So if Major W5 is going to duplicate Major W1 then the top to Primary W III is very close.
Internal count for Major W5 has the ES midway through an extended Minor W5 of Intermediate W3 off the Oct 15 Major W4 low. The top for Minor W5 will be followed by Inter W4 & W5 into a very significant long term peak.
Classic market theory holds that at market tops less and less individual issues participate. Following is the amount of the September to October sell off that has been retraced by a number of indexes since the mid October lows:
DJIA 103.0%
SPX 99.4%
NYSE 78.5%
RUT 77.3% (measured from the July high)
As can be seen, the broader based the index the less the retrace, which would lend credence to the idea that a top is in the process of being formed.
Thursday, October 23, 2014
Thursday, 10/23/14 update
What does the US Forest Service and the Federal Reserve have in common?
The US Forest Service has Smokey the Bear. Smokey was developed in the 1940's as part of a campaign to prevent forest fires. Forest fires were considered a threat to human welfare, so the push was on to prevent them. And a successful push it was. Except that it was determined in recent years that forest fires were actually beneficial - they served to clear out the underbrush and deadwood in the wildlands. Without the aid of periodic cleansing a forest becomes dense and overgrown. Inevitably a forest fire does occur, and it's far more destructive and uncontrollable than otherwise would be the case.
The Federal Reserve has Rocket the Bull (could probably add a four letter expletive to "Bull" and still be accurate). Otherwise known as the PPT (Plunge Protection Team). What many of us have long suspected has now become known as true. In recent years our friendly central bankers have actively intervened in the stock market via S&P 500 futures any time things got a little shaky. You see, it was determined that bear markets are a threat to human welfare. Also, and probably more to the point, the welfare of politicians and certain powerful bureaucrats. It occurs to me that the analogy to proper forest management is spot on - bear markets clear out the underbrush and deadwood. Without them the inevitable stock market forest fire is likely to be quite destructive and - yes- uncontrollable.
--------------------------------------------------------------------------------------------------------------------------
Above is the EW count I've been maintaining for the ES up until this week. But the action since the Wed, Oct 15 lows has taken a clearly impulsive form. Also, the drop from the Sep 19 high into last weeks lows is only 3 waves at best, for certain it's choppy nature did not form a completed 5 wave impulse. So the odds that the recent drop was just a short term correction and that new ATH's are forthcoming are high. So their is an alternate long term count that has to be considered:
As can be seen, the alternate has an extended Intermediate W5 in Major W3 so that the top for Major W3 is pushed out from last December to the recent Sep 19 high. This means that the recent correction is Major W4 of Primary W III with Major W5 currently in progress. Note that Major W5 will equal the travel of Major W1 at ES 2034.25. The interesting thing about this is that a channel drawn around the move up off of last week's lows shows the ES hitting that 2034.25 level right around election day the week after next. Hmmm.............
The US Forest Service has Smokey the Bear. Smokey was developed in the 1940's as part of a campaign to prevent forest fires. Forest fires were considered a threat to human welfare, so the push was on to prevent them. And a successful push it was. Except that it was determined in recent years that forest fires were actually beneficial - they served to clear out the underbrush and deadwood in the wildlands. Without the aid of periodic cleansing a forest becomes dense and overgrown. Inevitably a forest fire does occur, and it's far more destructive and uncontrollable than otherwise would be the case.
The Federal Reserve has Rocket the Bull (could probably add a four letter expletive to "Bull" and still be accurate). Otherwise known as the PPT (Plunge Protection Team). What many of us have long suspected has now become known as true. In recent years our friendly central bankers have actively intervened in the stock market via S&P 500 futures any time things got a little shaky. You see, it was determined that bear markets are a threat to human welfare. Also, and probably more to the point, the welfare of politicians and certain powerful bureaucrats. It occurs to me that the analogy to proper forest management is spot on - bear markets clear out the underbrush and deadwood. Without them the inevitable stock market forest fire is likely to be quite destructive and - yes- uncontrollable.
--------------------------------------------------------------------------------------------------------------------------
Above is the EW count I've been maintaining for the ES up until this week. But the action since the Wed, Oct 15 lows has taken a clearly impulsive form. Also, the drop from the Sep 19 high into last weeks lows is only 3 waves at best, for certain it's choppy nature did not form a completed 5 wave impulse. So the odds that the recent drop was just a short term correction and that new ATH's are forthcoming are high. So their is an alternate long term count that has to be considered:
As can be seen, the alternate has an extended Intermediate W5 in Major W3 so that the top for Major W3 is pushed out from last December to the recent Sep 19 high. This means that the recent correction is Major W4 of Primary W III with Major W5 currently in progress. Note that Major W5 will equal the travel of Major W1 at ES 2034.25. The interesting thing about this is that a channel drawn around the move up off of last week's lows shows the ES hitting that 2034.25 level right around election day the week after next. Hmmm.............
Saturday, October 18, 2014
Saturday, 10/18/14 upate
Very difficult pattern to analyze in EW terms since the Sep 19 ATH. Although the market was quite "oversold" by just about any measure by mid-week the EW count looks like it needs at least one more thrust down to new lows for the move. A possible target area is between 1801.25 where Intermediate W3 = 3 x Intermediate W1 and 1791.00 where Minor W3 = 3 x Minor W1. If this downdraft develops it will likely generate momentum divergences on a variety of technical indicators and could be an opportunity for a long play. But extreme caution should be exercised in that eventuality.
Long term view:
Notice how that 1795 - 1805 area has acted as a pivot in the last year.
Sunday, October 12, 2014
Sunday, 10/12/14 update
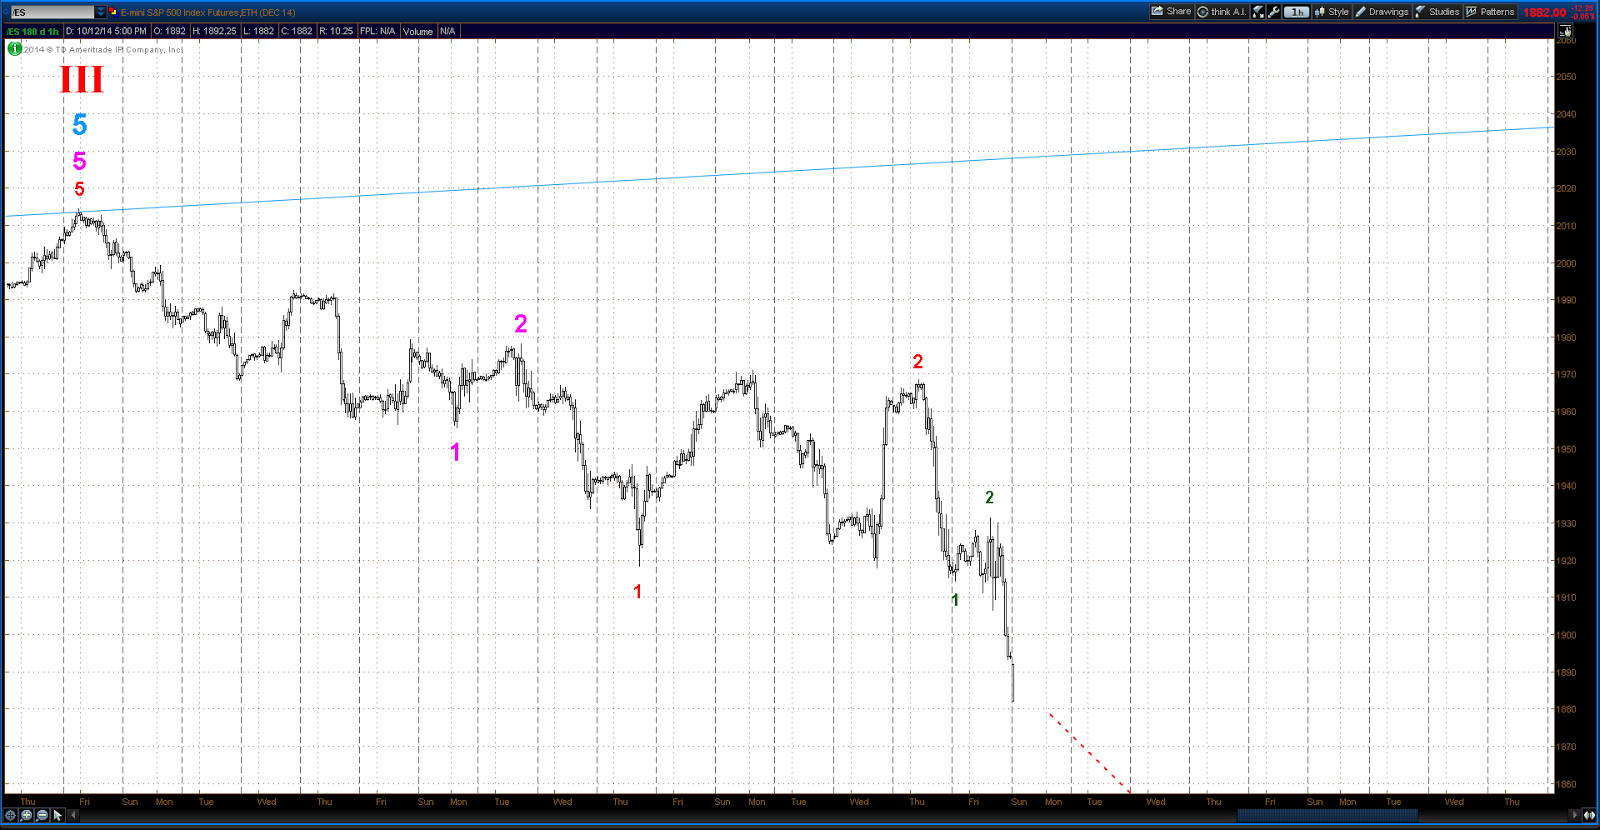
Epic bull/bear battle last week, but the bears were decidedly victorious, inflicting considerable technical damage in the process. The top for the three year bull market dating back to Oct 2011 is confirmed as in place. Current EW count is that the Sep 19 highs are the top for Primary Wave III of the long term uptrend dating back to the Mar '09 lows. Primary Wave II was a flat, and the C wave of that structure lasted 5 months and took around 25% off the ES/SPX. Primary Wave IV is now in progress and should alternate with a zig-zag or triangle. It should roughly equate to Primary W II in price damage and duration.
The short term picture shows a quite choppy pattern since the Sep 19 ATH. The best count is that of a series of nested 1st & 2nd waves as below, but this will quite probably have to be revised as the move matures.
One final note. The fact is that there are only 3 completed waves up off the Mar '09 lows. Thus the possibility that the whole run from those lows is in fact a corrective wave still remains open. This would portend a crash more severe than that of 2007 - 2009. Odds of this being the case have to be regarded as low at this point, but it is possible.
The short term picture shows a quite choppy pattern since the Sep 19 ATH. The best count is that of a series of nested 1st & 2nd waves as below, but this will quite probably have to be revised as the move matures.
One final note. The fact is that there are only 3 completed waves up off the Mar '09 lows. Thus the possibility that the whole run from those lows is in fact a corrective wave still remains open. This would portend a crash more severe than that of 2007 - 2009. Odds of this being the case have to be regarded as low at this point, but it is possible.
Saturday, October 4, 2014
Saturday, 10/4/14 update
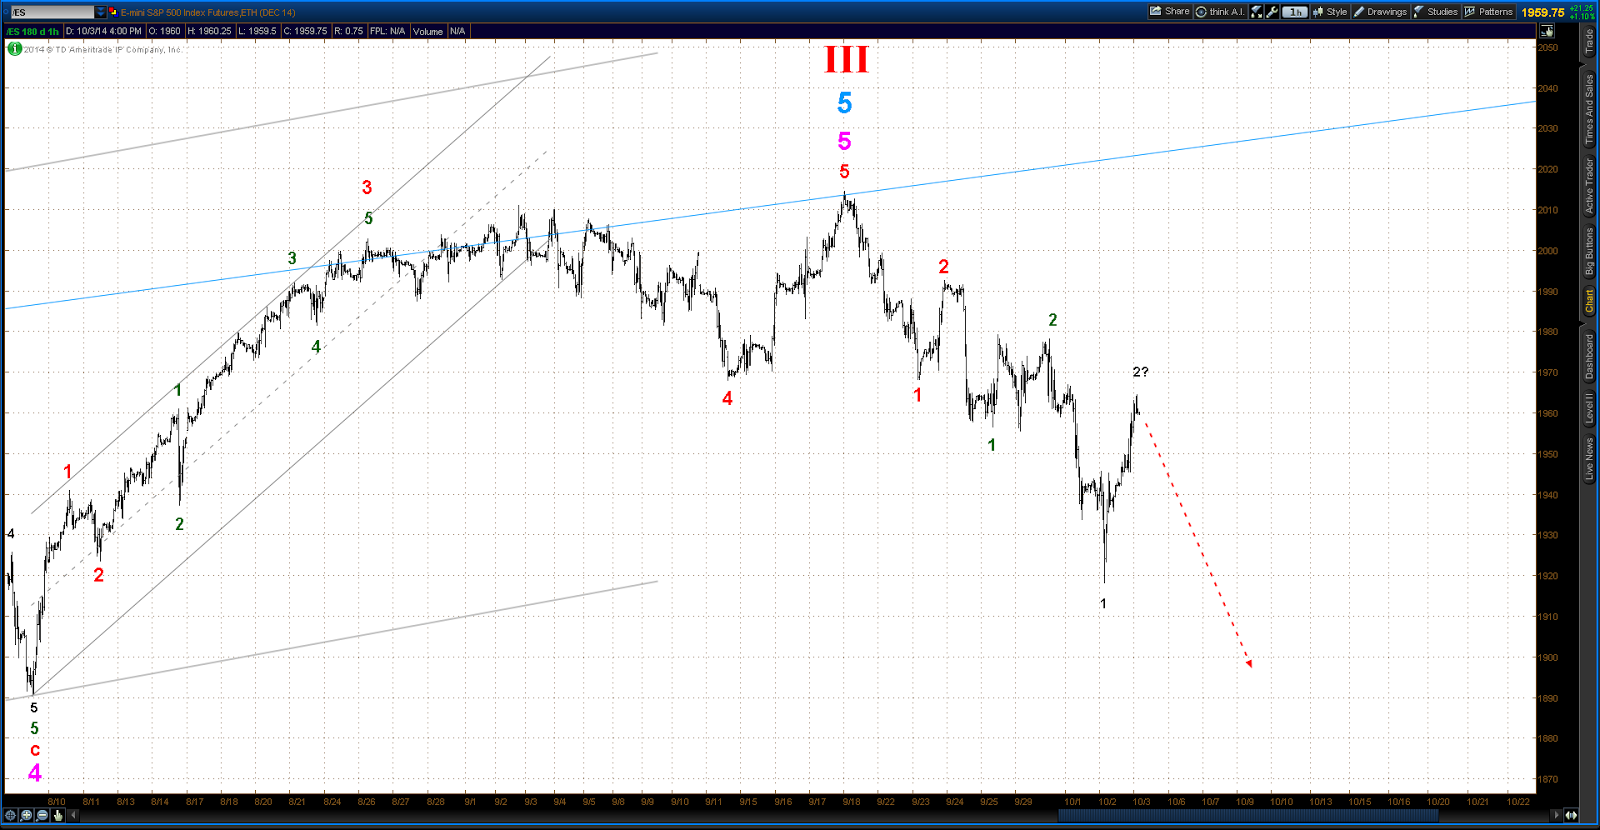
One would like to think that a significant top in equities was seen in mid September and that the long awaited bear market correction is in progress. Certainly looked that way earlier this week. But "Al's Daily Indicator" signaled the likelihood of a bounce of some sort on Thursday and sure enough the ES moved up sharply off of Thursday's lows and continued rallying into Friday's close.
So the intermediate term trend is still an open question. A move above ES 1980 will greatly increase the odds that the trend is still up and new ATH's are forthcoming. The alternate counts are as follows:
Top already in:
Top not yet achieved:
So the intermediate term trend is still an open question. A move above ES 1980 will greatly increase the odds that the trend is still up and new ATH's are forthcoming. The alternate counts are as follows:
Top already in:
Top not yet achieved:
Subscribe to:
Posts (Atom)