CURRENT CHARTS


Click HERE to view current charts


Monday, October 11, 2010

Monday 10/11/10 wrap up

Pretty dull day in the ES except for some selling in the last hour.  The ES dropped about 6 points and bottomed around 2:30 (CST) and then promptly snapped back into the close to end pretty much unchanged.  That puts a Doji in on the daily chart but it was a holiday so the Doji may be meaningless.


Current preferred ES count-

Trend/Osc hourly and daily trends on the ES remain UP


The EUR broke it's uptrend line on the hourly chart and closed right at the uptrend line on the daily chart.  This is the 1st component of a sell signal on the hourly, the Dynamic Oscillator needs to break below 80 with prices remaining below the uptrend line for a completed sell signal on that time frame.  Same applies to the daily, so this market bears watching (no pun intended!).

Sunday, October 10, 2010

Weekend Update 10/9/10

A lot of people were looking for a pullback in the SPX et. al. this week and were disappointed (or worse).  The market did indeed look like it was in the process of rolling over coming into the week.  And of course there were various indicators on various time frames showing "overbought".  That's the essential problem with indicators, they are just that :  indicators - they are not definitive.

I think one of the first adages I learned when I started trading was "The trend is your friend" and of course the corollary "Don't fight the tape".  But how does one decide what the trend is, and maybe more importantly, when is the trend changing?  That's what the Trendline/Oscillator System was designed to accomplish.  I started a description of that for this blog (see sidebar) but haven't completed it.  I do intend to finish the write up at some point.  But the real guts of the concept are in what I've committed to writing so far.  The approach is a fairly simple one, KISS is a great rule, but I know from experience that it is quite effective.
Applying the Trend/Osc to an ES daily chart we see that we are maintaining an uptrend that started in late August.  As long as prices stay above the uptrend line connecting the lows of Aug 31 and Oct 4 and the Oscillator stays above 80 we are in bull mode on the daily.


The hourly ES Trend/Osc is also in bull mode since a buy signal of last Tuesday.


The Buy/Sell Vindicator has been showing some excellent entry points during the bull run from late August.  It was observed last winter that a reading of 1000 on the dominant trend (Buy line in this case) serves as trend support.  In this case, over the last 4 weeks whenever the Buy line got in that 1000 area it was an excellent long entry point.  That happened four times in the period as indicated by the highlighted areas.
 

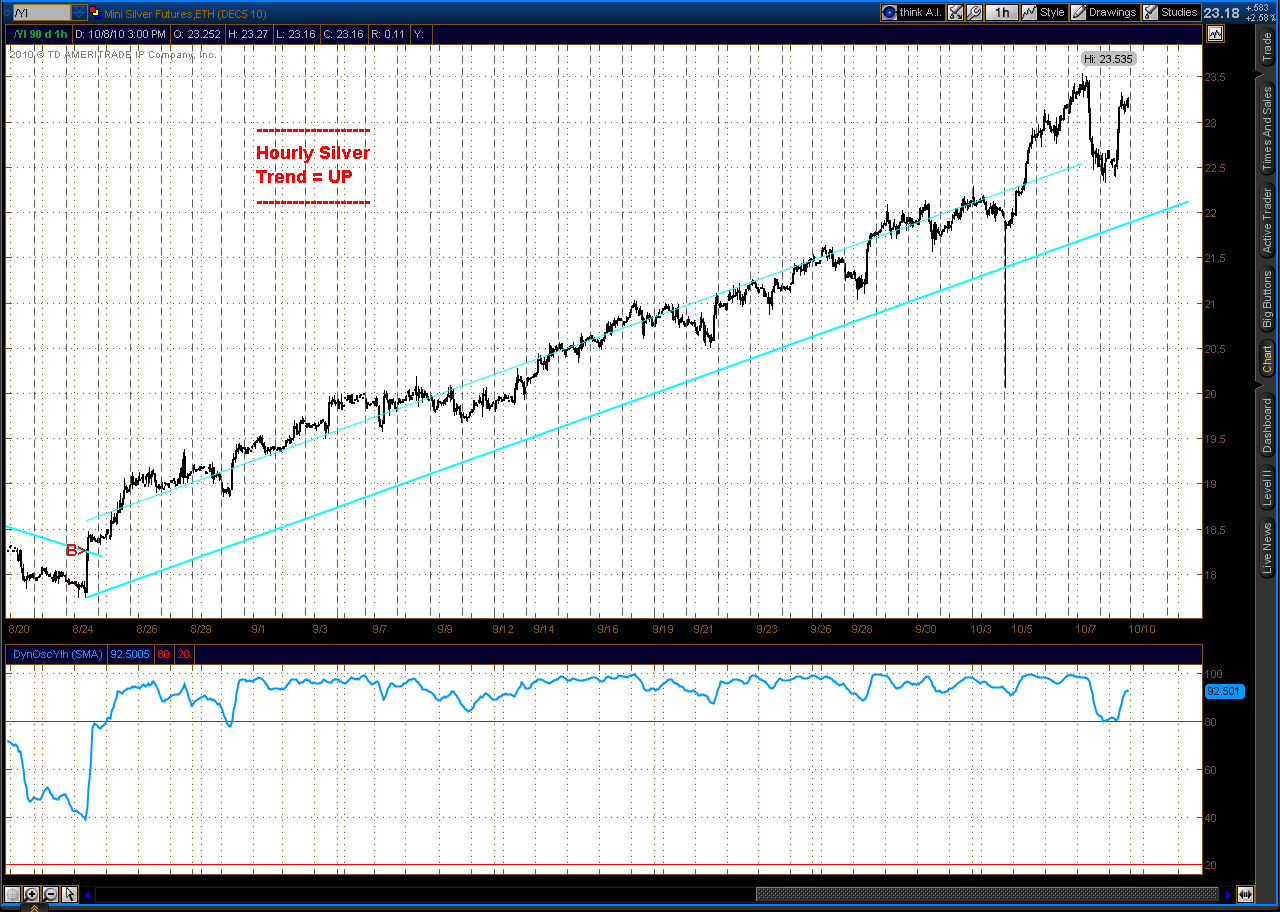
I will be expanding market coverage on this site using the Trend/Osc System.  The markets being added are the EUR (Euro/US Dollar), AUD (Australian Dollar/US Dollar), YG (E-mini Gold) and YI (E-mini Silver).
All four of those markets are currently in uptrends on both their hourly and daily charts.  Of those four the only one that looks real interesting is Gold. The YG looks like it may be near a downturn on the hourly chart.  On Thursday and Friday it sold off and bounced right off the uptrend line connecting the lows of Sep 28 and Sep 30.  The pattern of the sell off is in 5 waves so it looks impulsive rather than corrective.


Thursday, October 7, 2010

Thursday 10/7/10 wrap up

Little bit deeper retrace today which in fact turned precisely at the .382 level against Monday's rally.  The correction took the shape of an irregular flat.
 
If this count is correct we should explode up tomorrow as we are in the 3rd of a 3rd of a 3rd wave.

Both the hourly and daily Trend/Osc are in bull mode.  On the hourly Trend/Osc the Dynamic Oscillator dropped below 80 today but as long as prices hold above the uptrend line the hourly is signaling up.  If we print a new high for the move the Dyn Osc will reset and probably poke back above 80.

Wednesday, October 6, 2010

Wednesday 10/6/10 wrap up

A little bit of a dip, around 25% of yesterday's rally which is a bit shallow.  However, if we are in fact in a 3rd wave that's quite acceptable and is even to be expected.  We'll see.

Went long ES around 12:30 PM today at 1152.50, still holding.  Hourly Trend/Osc continues in bull mode.

Daily Trend/Osc also continues in bull mode.

Tuesday, October 5, 2010

Tuesday 10/5/10 wrap up

Well we sure did find a direction - no sloppy choppy mess today.
They say he who hesitates is lost.  The hourly Trend/Osc generated a buy signal this morning at 8 AM, I covered the short ES's @ 1144.00 so pretty much breakeven there, but didn't go long thinking I would wait for a dip to buy in at a better level.  Next time I looked the market was a runaway, so now I'm waiting for a decent retrace to go long.  Should have executed when the Trend/Osc gave it's signal and not tried to play cutsie.

With today's highs the trendline and oscillator in the Daily Trend/Osc were reset, thus the bull mode continues from that standpoint.
  
Most likely Elliott count looks like this:

Monday, October 4, 2010

Monday 10/4/10 wrap up

Nice thrust down today, but still we wind up with a choppy overlapping mess.  We've essentially been trendless for 6 days now with the ES pretty much bouncing between 1130 and 1150.  Below Elliott count is only one of many possibilities.  Until the market moves definitively in one direction or another it's difficult to say which possibility is correct.  My inclination is bearish, participation is still light and it IS October.

Although the ES has definitively broken below the recent uptrend line on the daily Trend/Osc the Dynamic Oscillator is still tracking above 80, so no sell signal on the daily at this point.

The hourly Trend/Osc is still in sell mode, but it wouldn't take much to move this back to a buy.  Still holding Friday's short ES from 1143.50.

Saturday, October 2, 2010

Weekend Update 10/2/10

Not a lot has changed since last weekend's update, although the market appears more bearish than bullish for the very immediate future.  Prices were in a very sloppy and choppy sideways drift all week with the exception of Thursday.  On Thursday there was a very clear and distinct 5 wave impulse down, the only clear move at all for the week.  This puts a bearish light on things.  In addition, the hourly Trend/Osc system switched to sell mode on Friday.

BULL alternate #1 (ES hourly chart)
Shows us in the C leg of a flat type wave 2 correction to September's wave 1 rally.  ES targets are the 1103 and 1090 areas.  When wave 2 is complete it will usher in wave 3.  By definition that wave 3 should be strong and relentless.


BULL alternate #2 (ES hourly chart)
Has wave 2 to September's wave 1 complete at the lows of Thursday, 9/23 with a series of waves 1 - 2's since then.  Less likely alternate IMO due to the choppy nature of the action since 9/23 -  if this count is correct we are in a wave 3 which should be much stronger and more definitive.

BEAR alternate (ES daily chart)
Should not be ignored.  October is historically the most bearish month of the year, and the September rally could well have been the set up for a classic October crash.  As has been mentioned multiple times on this blog, market volume has been and remains comparatively weak since the March '09 cycle lows.  Rally momentum since the initial ramp up of early September has clearly waned and the chart looks like it's beginning to roll over.  


The daily Trend/Osc is flirting with a sell signal with a close below the uptrend line on Thursday and barely above it on Friday.  A close below that uptrend line accompanied by a break below 80 on the Dynamic Oscillator will generate an official sell signal on this time frame.  Conversely a new high for the move up from late August will reset the uptrend line and possibly avert any potential sell signal for the time being.  

 The hourly Trend/Osc generated a sell signal Thursday evening with a close below the uptrend line from 9/23 (the Dyn/Osc was already tracking below 80).  The long ES's from 9/24 entered @ 1135.00 were sold Friday morning at 1143.50 for a gain of 8.50 points and a short ES position was established at that 1143.50 level.  Not the best of gains on the long trade, but given the whipsaw nature of last week's market I guess it wasn't all that bad.  Still holding short ES but nervous about "ramp up Monday".