CURRENT CHARTS


Click HERE to view current charts


Monday, October 18, 2010

Monday 10/18/10 update

2:45 pm
Last night's sell signal on hourly ES is canceled with today's new highs.  Comment this morning concerning triangle and anticipated thrust in preceding direction has played out as anticipated.


8:35 AM
Sell signal on hourly ES overnight when prices closed below uptrend line dating from Oct. 4 - Dyn Osc was already below 80.

However daily ES still showing UP trend.

Pattern on the hourly ES chart since last Wednesday looks very much like a triangle (wedge) which usually precedes a final thrust in the prior direction, so looks like this is a short term long opportunity developing.

Friday, October 15, 2010

Friday 10/15/10 update

1:00 PM
I posted the below chart last weekend showing the Buy (green) line of the Buy/Sell Vindicator bouncing off the 1000 level repeatedly over recent weeks.  Those situations have all been excellent long entry points.

The Buy line is currently below that 1000 level, so we may be near another good long entry point.  However, it has penetrated that level and is currently pointing lower, so there is a danger that this time it's showing us a change in trend from bull to bear.  Bottom line is if the ES works it's way down to the area of today's lows @ ES 1163 it might be worth a long entry but with a conservative stop.


10:00 AM
Sell signal on EUR hourly with close below uptrend line an hour ago and break below 80 on Dyn Osc at the turn of this hour.  Daily EUR chart still showing in up mode, but we may be building a top with the action of this week.  Hourly sell signal is canceled if the EUR trades above today's high of 1.4156.


Thursday, October 14, 2010

Thursday 10/14/10 wrap up

Haven't had time to do an Elliott count this week, but there is a lot of wave overlap in the ES which raises some questions about the nature of the rally since the late August lows.  The questions could be answered with an explosive rally.  Barring that, it's possible that we're in the C leg of an A-B-C up from those August lows rather than a 3rd wave of a 5 wave structure.  I'll try to chart that alternative when time permits. 
ES is flirting with another sell signal on the hourly chart with the Dynamic Oscillator dipping below 80 today, but it did turn back up with the end of day rally and prices remain above the uptrend line.  The daily chart is still solid up.

The EUR resolved it's situation with the new highs of today.  The uptrend line and Dyn Osc reset as a result of those highs and the EUR is now back in solid up mode on the daily chart.

Wednesday, October 13, 2010

Wednesday 10/13/10 wrap up

ES is solid up, both hourly and daily.

ES looks like it might extend up.  Using fibonnaci and based on the "1 or A" leg marked on the chart we've surpassed equality to that leg Tuesday, the next target would be 1.618 times that leg, which is ES 1239.

All though still technically in up mode, the EUR continues to look wobbly on both the hourly and daily Trend/Osc.

Wednesday 10/13/10 update

EUR CHARTS
   
Tuesday Sell signal canceled with break above downtrend line. 


New uptrend line as well as Dynamic Oscillator reset.


EUR daily chart - prices still trading below uptrend line, uptrend thus wobbly. However Dyn Osc still holding above 80.  


Sell signal on EUR is canceled this morning when prices broke above downtrend line for the selling that started last Thursday - Dyn Osc already was above 20.  However daily EUR Trend/Osc still shows prices trading below daily uptrend line so that trend is still in question.
For some reason the blog software is not allowing me to upload charts this AM, I'll try a little later.

Tuesday, October 12, 2010

Tuesday 10/12/10 wrap up

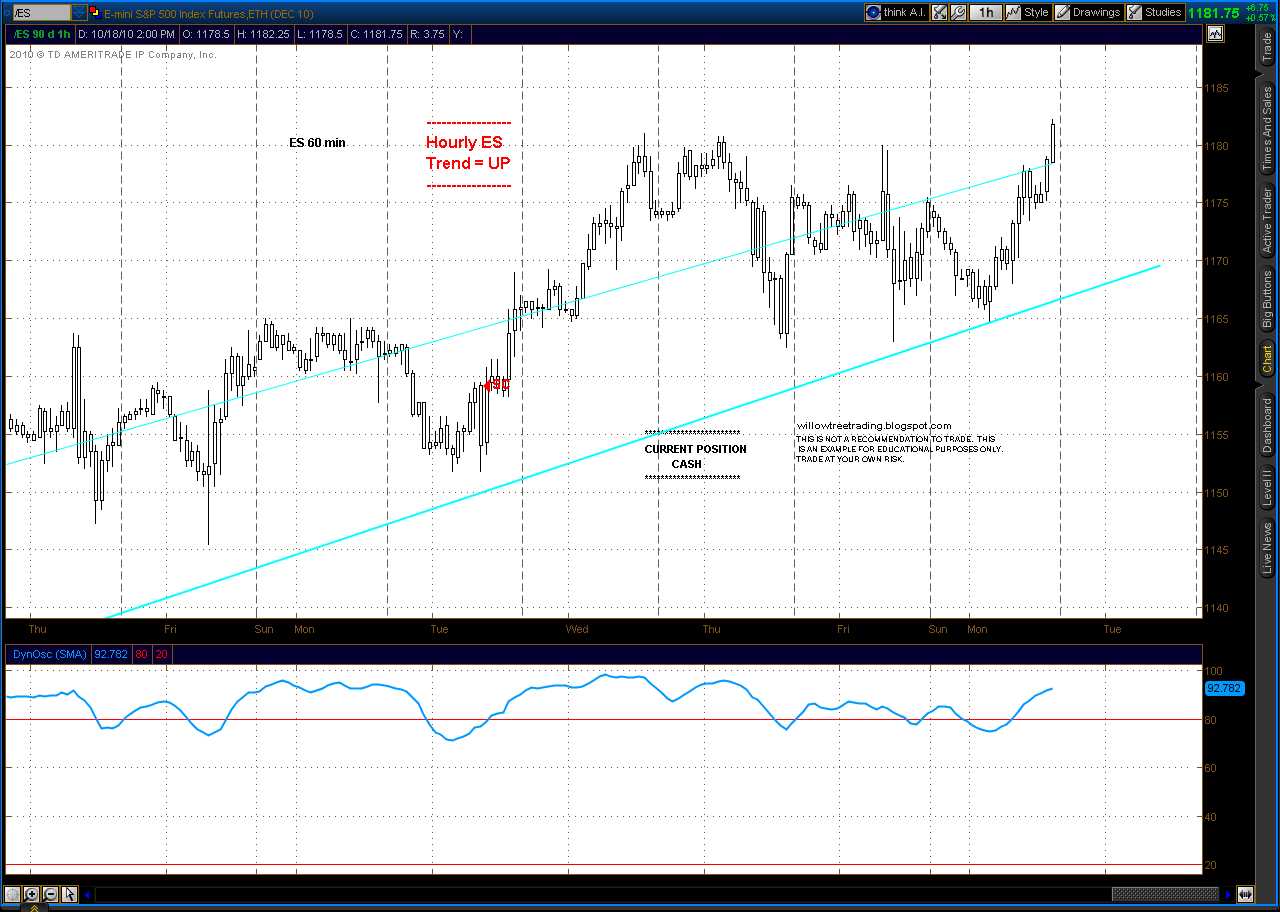
The main weakness in the Trend/Osc system is a tendency to whipsaw, especially at trend changes.  We saw that today.  We may not necessarily be topping, but we did get a whipsaw.  The Dyn Osc broke below 80 late last night followed by prices breaking below the uptrend line early this AM (highlighted in chart) - so we had a sell signal.

I closed my long ES's this morning based on that signal but did not go short.  My plan was to wait for overbought conditions on several indicators I follow on a 5 minute chart, that situation did not develop all day.  With the new highs this afternoon the sell signal was canceled and the trendline and oscillator were reset.
Current Hourly ES Trend/Osc chart:

One thing that made me cautious on the short side today was the fact that the Daily ES Trend/Osc remains in bull mode:

The Hourly EUR Trend/Osc also generated a sell signal last night overnight:

I'm being cautious with this market as well for the same reason I was cautious with the ES today - the Daily EUR trend/Osc is still in bull mode. However, it is a little shakier than the ES as prices traded below the uptrend line all day.  If the strength exhibited today in the EUR pushes it to new highs tomorrow the uptrend line will be reset to connect the low at the start of the trendline with today's low.

Tuesday 10/12/10 Update

Sell signal on ES is canceled with the new high this PM.  Both the trendline and Dynamic Oscillator reset as a result.

Sell signal overnight on EUR hourly - prices broke below uptrend line yesterday and Dyn Osc broke below 80 at 5 AM (CST).


Sell signal on ES overnight on Trend/Osc System, closed long ES's.