
To explain the 2nd X wave count it's necessary to back out to a longer view first.

This is Daneric's count (http://danericselliottwaves.blogspot.com/) through the high of 4/26/10 and is one version of P3, with the difference from the X wave count being the low of Mar '09 labeled as Cycle Wave I and the high of 4/26/10 labeled as Cycle Wave II. That period is labeled as three successive zig-zags and can just as appropriately be considered to be the major wave A of an A-B-C type X wave sequence. Since 4/26 we've had the A-B legs of the major wave B of X, and are currently in the C leg of that sequence. That C leg is itself unfolding in an a-b-c fashion, and we are currently in the c leg of that final sell-off. Thus by this count we are in the final stages of the major wave B correction.

On the Vindicator, fact is that there is still a learning curve to be climbed. There are times when I wonder if it has any real value, such as Friday. But on review, and with the benefit of hindsight, the Vindicator was signaling the approach of a down move:
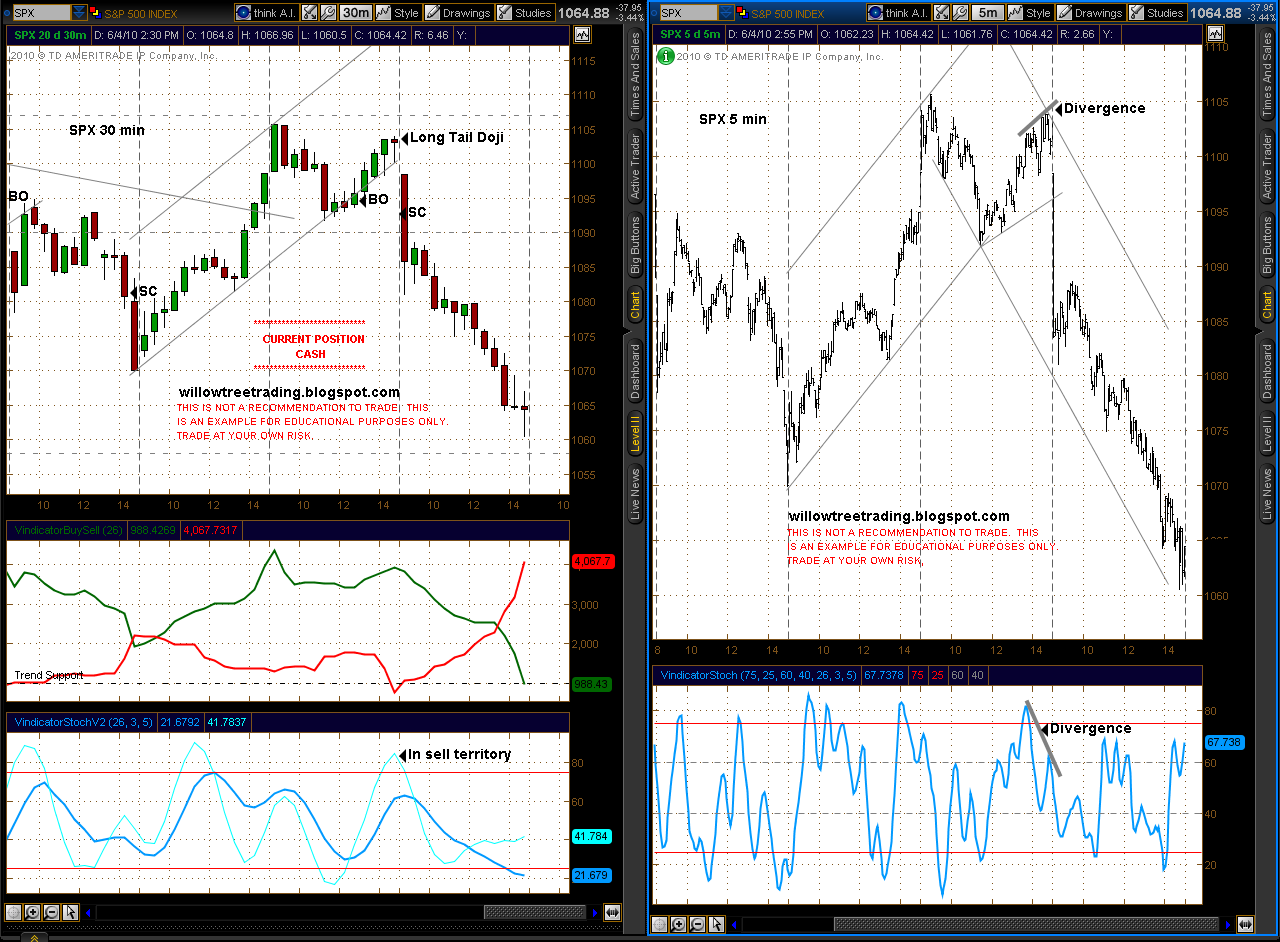
Several things to note on the above charts:
1. 30 minute V Stoch slope topping at the close on Thursday
2. Last 30 minute bar on Thursday is a doji with a long tail
3. Clear bearish divergence on the 5 minute V Stoch also in the last half hour of Thursday trading
One final chart to buttress the case:

The highlight in this chart is the Vindicator Buy/Sell line. Although the Buy line pretty much retained ascendancy over the sell line since it crossed up on 5/25 it's been steadily tailing away since a peak on 5/27 , establishing a clear bearish divergence in the process. It was giving a message (loud and clear) that buying pressure was waning. As I said, there is still a learning curve with the Vindicator.

OK I get your wave count. After we finish the major B coming soon at scary lows, we trace another huge leg up for major C which will end up as an X wave from march 666 low. Makes sense to me. Thanks
ReplyDeleteThanks Al. Hard to argue with the logic of your analysis, and the opportunity that presents itself to us. Now the trick is to take advantage of this volatility to the fullest and hope for some clear indications of the waves as we move forward! Best of luck.
ReplyDeleteThank you Al - really great post :) One question... the move from the 1039 /es low seemed painfully corrective, and the move down from 1105ish seems much more impulsive. With the spx 200 dma overhead whacking us everytime we get close to it, p/e ratios out of control, and cnbc traders telling the common folk that the market is going lower... what do you think it's going to take to make us impulse up? oh... actually... two questions... do you think that it's possible that the move since the peak has been one 3-wave A and we are in 5 of c of that wave?
ReplyDeleteAgain .... amazing post! I've read it twice and going back now again :) see you monday dear
Can't tell you what news it would take to make us impulse up if that's what you're asking - if I was that good I'd be working from my private Caribbean island. As far as your question about move from the peak, which peak? If you mean Thursday's peak, definitely not 3 waves and definitely is a very impulsive 5. If you mean the peak of 4/26, and if I understand what you're saying, I assume you mean that the intermediate high of 5/13 is the start of that C leg as in my count, in which case it's appropriate to count the action since then as a 3 wave sequence rather than 5 to satisfy Elliott rules. Here's my detailed count since 4/26 http://screencast.com/t/Y2RlYjIw
ReplyDeleteThanks Rati
ReplyDeleteDon't forget this is only one of many possibilities, obviously I believe it's the higher probability but it's not necessarily correct
ReplyDeletea great post, al, thanks very much. the vindicator has some subtleties that will reveal themselves over time, but it's obviously a wonderful tool. you deserve a lot of credit for developing it, and sharing it with the rest of us goes beyond wonderful. now I have to read this post again to make sure I understand it! hahahaha
ReplyDeletecAN'T GET INTO UPDATE SITE SO FYI SHORT ES @ 1064.75
ReplyDeleteCAN'T GET INTO UPDATE SITE SO FYI SHORT ES @ 1064.75
ReplyDelete