CURRENT CHARTS


Click HERE to view current charts


Monday, July 27, 2015

Monday, 7/27/15 update

Al's Daily Indicator is solidly in buy territory on both the 10 day and 20 day basis:

10 day

20 day
This is not a buy signal, just a precondition for a buy.  Need to see a break above the downtrend line defining the sell off so far.  A break above a reading of 1.00 on these indicators would also help confirm that a low is in place.

Saturday, July 25, 2015

Saturday, 7/25/15 update

Two long term possible counts remain in play for the ES:

Alternate #1

Alternate #2

Alternate #2 seems a better fit from an EW standpoint.  A more lengthy discussion of these two alternates can be found here.

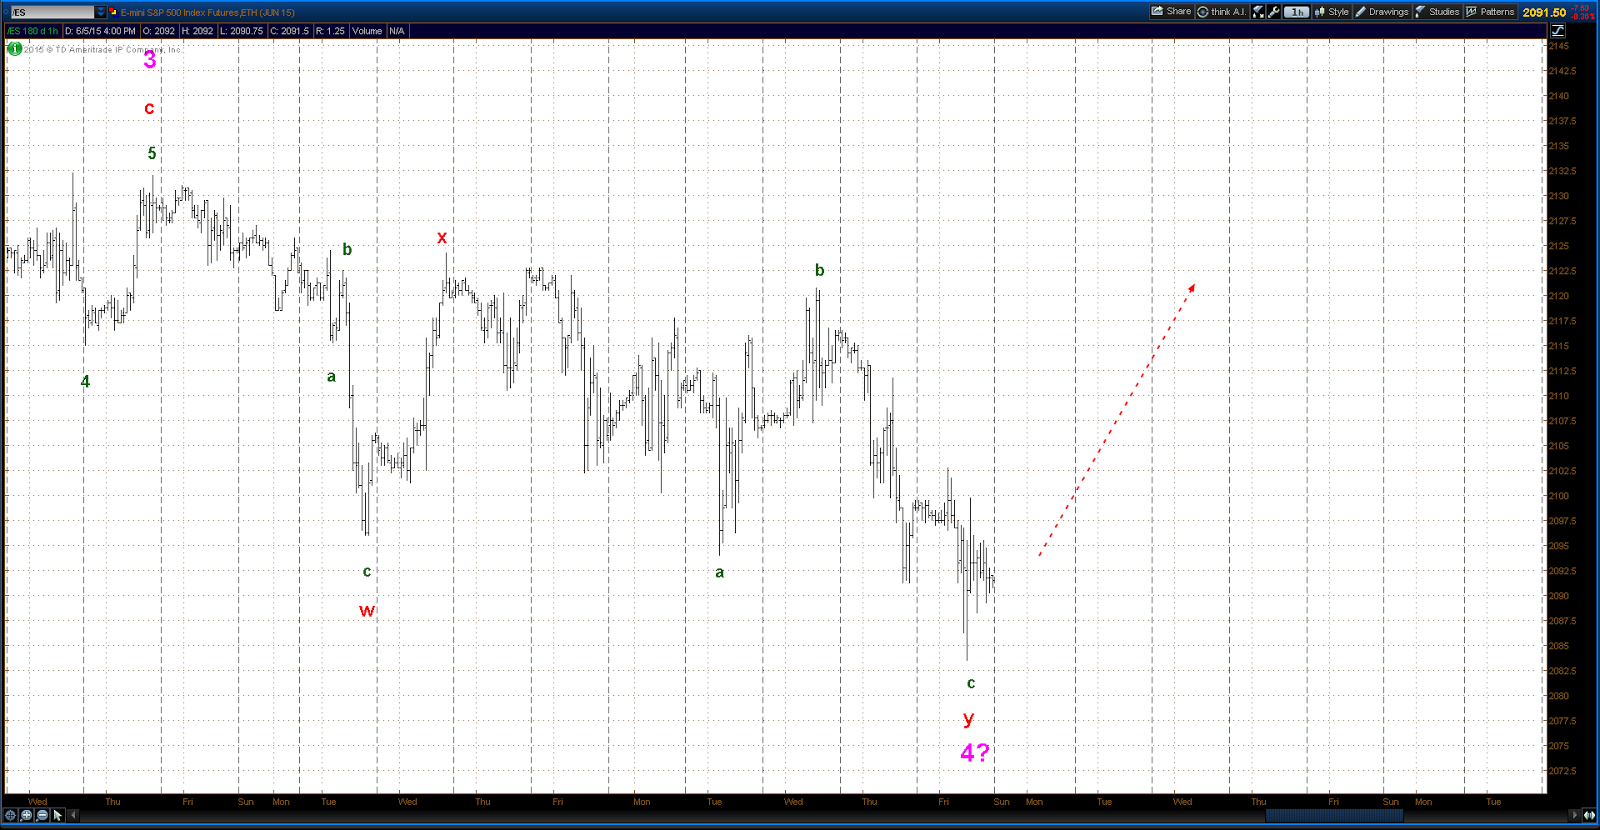
 Short term chart:


Sunday, July 5, 2015

Sunday, 7/5/15 update

Big hit on equities Monday into Tuesday last week, "oversold" bounce the rest of the week.  And a bounce is exactly what it looks like with a choppy and overlapping pattern.


Price chart is the NYA.  The uppermost of the two indicators below the price chart incorporates volume, adv/dec & rate of change statistics, the bottom indicator is an analysis of the NYSE tick.  On Tuesday & Wednesday both those indicators rocket up from buy territory to sell territory, but prices don't put a strong impulse pattern in place.  So it appears that on the very short term a correction is winding it's way out and more bear action is on it's way.

Also on the VST there are two possible EW counts of the action since the Jun 22 high.  Both alternates contemplate further selling to come:

 Alternate #1


Alternate #2


Saturday, June 27, 2015

Saturday, 6/27/15 update

EDIT - 6/28 - "NEVER MIND" - Roseanne Rosannadanna, SNL


"History does not repeat itself, but it rhymes" - Mark Twain

The pattern in the ES last week looks very much like a fractal of the bear move of May 21 to Jun 16:


If so, the outcome should be the same.

Saturday, June 20, 2015

Saturday, 6/20/15 update

The chop continues in the ES/SPX aaaargh!!  There is no clean Elliott pattern in the ES since the highs in May.  Five legs can be discerned in the move down from those highs into this weeks low, but they overlap, so the pattern is either a triple zig-zag or some type of leading diagonal:


They fit into the intermediate term counts as below:


Saturday, June 6, 2015

Saturday, 6/6/15 update


More selling this week.  But still choppy looking, and no break below the lower boundary of the trading range that's been in place in recent months.  It should be noted that the proposed ending diagonal since the start of the year can be counted as complete at the mid-May highs (not shown).  If this is the case, the pattern since those highs is an ugly looking set of nested 1st & 2nd waves that should soon accelerate into 3rd wave territory. However, the lack of a clearly impulsive structure since those highs argues for at least one more move to new all time highs before the ending diagonal is complete.  Until and unless the market morphs into some more serious downside action the benefit of the doubt has to be given to the bull case.

Saturday, May 30, 2015

Saturday, 5/30/15 update

After teasing us with new highs the week before last the ES has lapsed back into a sideways chop.  There are now a myriad of alternate possible EW counts, but I favor an ending diagonal of some sort because a sideways chop fits that type of pattern.  Following are updates on the two alternates that have been followed in recent weeks, both of which can now be viewed as recently forming an ending diagonal on one time frame or another.  The significant practical difference between the two is that Alternate #1 has a very significant Primary W III top very close by whereas Alternate #2 has that top off in the distance.

Alternate #1

Alternate #2